Getting Started with the Management User Interface
The Management user interface provides mechanisms for adding parsers, enriching telemetry events, configuring and prioritizing threat intelligence, and tuning parser Storm parameters.
| Tools | Description |
|---|---|
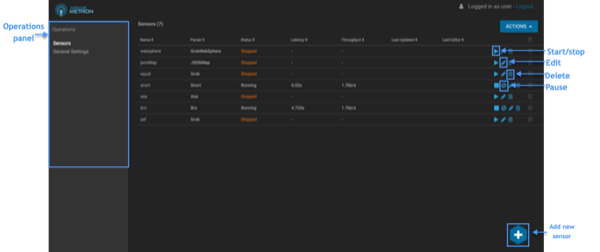
| Operations panel | You can use the functions in the Operations panel to view existing sensors or view general settings. |
| Management icons | You can use the management icons to start, stop or pause a sensor, edit a sensor, or delete a sensor. |
| Add new sensor | You can change the status of or dismiss an alert. |
| Meta Alerts |
The meta alert feature enables you to create a system entity that contains a collection of filtered alerts. |
You can use the sensor panel in the Management user interface to create new sensors.
| Tools | Description |
|---|---|
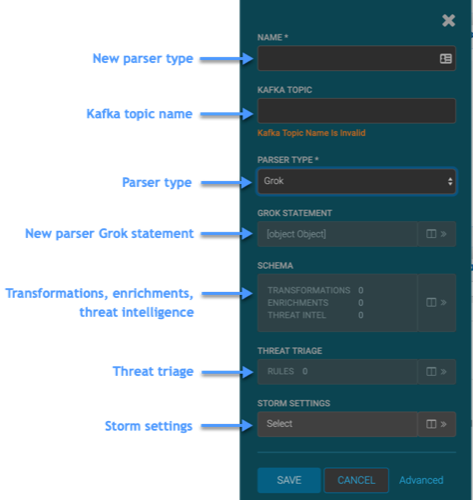
| New parser name | The name of the new parser. This name typically matches the name of the telemetry. |
| Kafka topic name | The name of the Kafka topic. This name typically matches the name of the telemetry. |
| New parser type | The type of parser you are creating. |
| New parser Grok statement | The Grok statement for the new parser. |
| Transformations, enrichments, threat intelligence |
Displays the panels for transforming the telemetry data or adding enrichments and threat intelligence information. |
| Threat triage | Displays the panel to prioritize for the telemetry threat intelligence information. |
| Storm settings | Displays the panel to configure Storm settings. |
| Tools | Description |
|---|---|
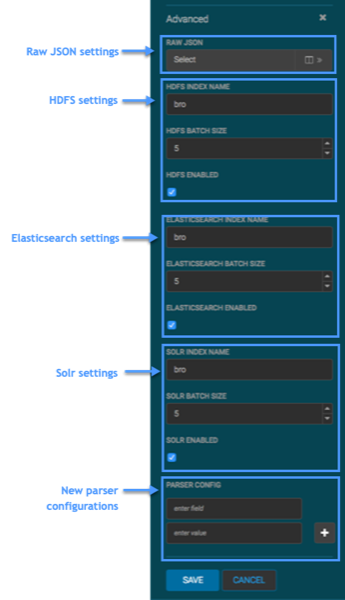
| Raw JSON settings | Displays the panel to add or modify the sensor parser configuration, enrichment configuration, and indexing configuration. |
| HDFS settings | Enables the HDFS index, and specifies the HDFS name and batch size. |
| Elasticsearch settings | Enables the Elasticsearch index, and specifies the HDFS name and batch size. |
| Solr settings |
Enables the Solr index, and specifies the HDFS name and batch size. |
| New parser configurations | The name and value for a new parser configuration. |