Running SQL Stream jobs
Every time you run an SQL statement in the SQL Stream console, it becomes a job and runs on the deployment as a Flink job. You can manage the running jobs using the Jobs tab on the UI.
- Parse: The SQL is parsed and checked for validity and then compared against the virtual table schema(s) for correct typing and key/columns.
- Execution: If the parse phase is successful, a job is dynamically created, and runs on an open slot on your cluster. The job is a valid Flink job.
- Make sure that you have registered a Data Source if you use the Kafka service on your cluster.
- Make sure that you have added Kudu, Hive or Schema Registry as a catalog if you use them for your SQL job.
-
Click
 next to Jobs from the Explorer.
-
Add a SQL query to the SQL Editor.
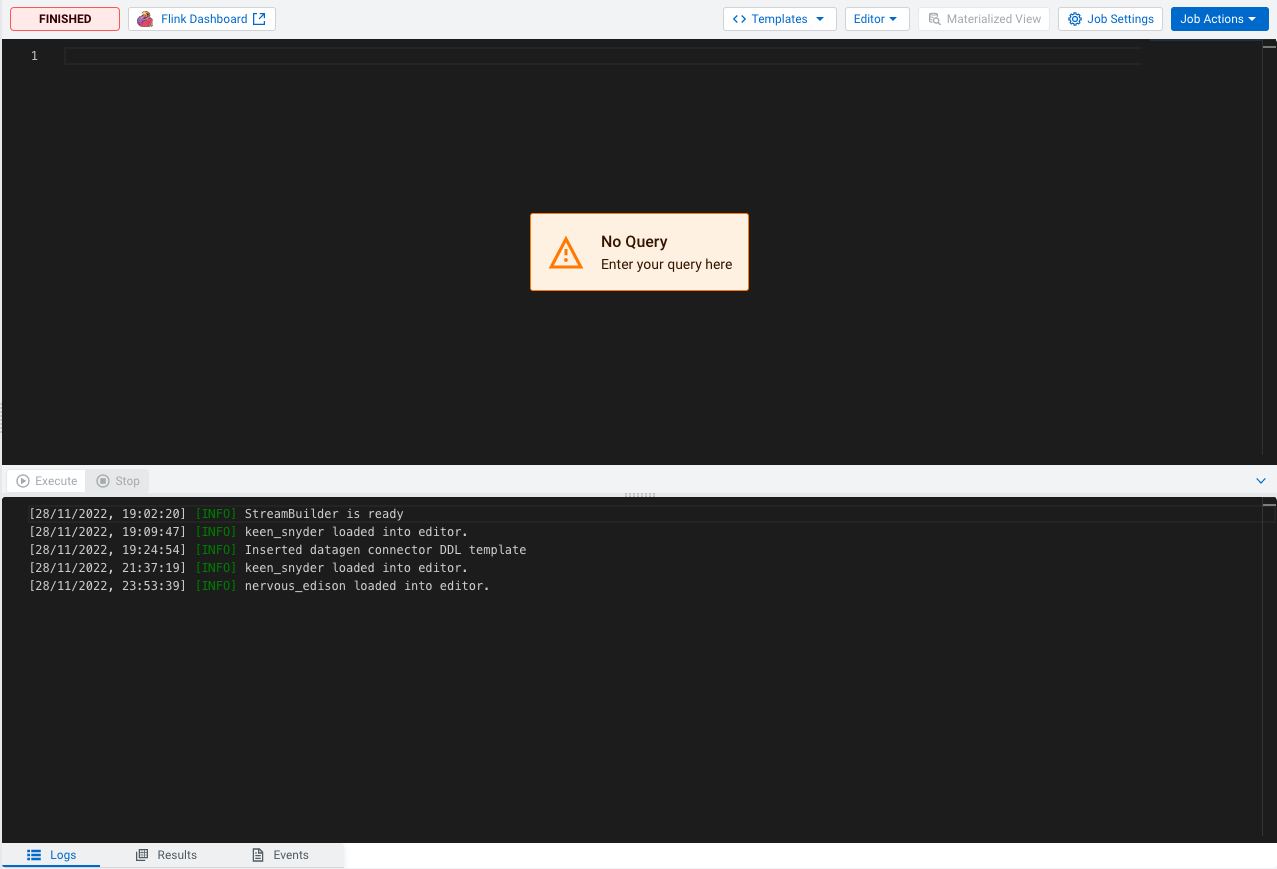
When starting a job, the number of slots consumed on the specified cluster is equal to the parallelism setting. The default is one slot. To change the parallelism setting and more job related configurations, click Job Settings.
-
Click Execute.
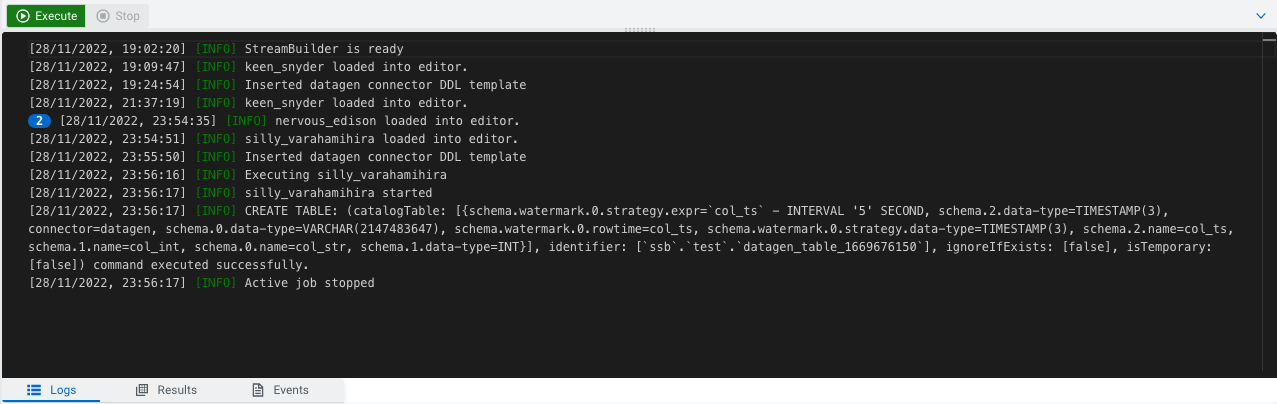
The Logs window updates the status of SSB.
-
Click Results to check the sampled data.
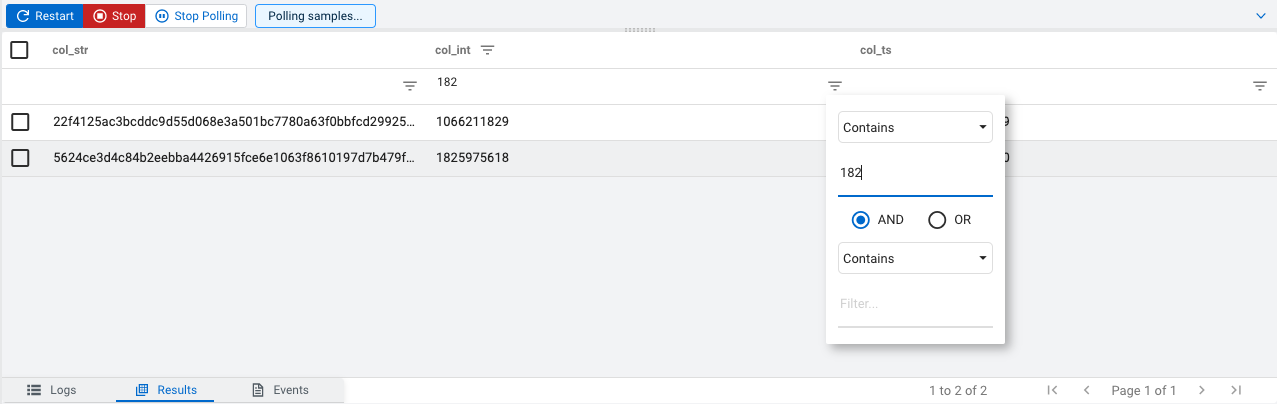
You can pause or restart the sampling of a SQL job with the Pause and Refresh buttons. The status of the polling can also be seen next to the Pause button. The Results tab also allows you to change the order of the samples, and to filter the samples using different types of conditions that you can also combine. For changing the order, click on the name of the column, the direction of the ordering is indicated next to the column name by arrows.
For filtering, you can either click the
 button
next to the column name or under the row of the column name. The filtering value can be
changed by typing the values directly to the filtering row, the conditions need to be
changed using the filtering arrow.
button
next to the column name or under the row of the column name. The filtering value can be
changed by typing the values directly to the filtering row, the conditions need to be
changed using the filtering arrow. -
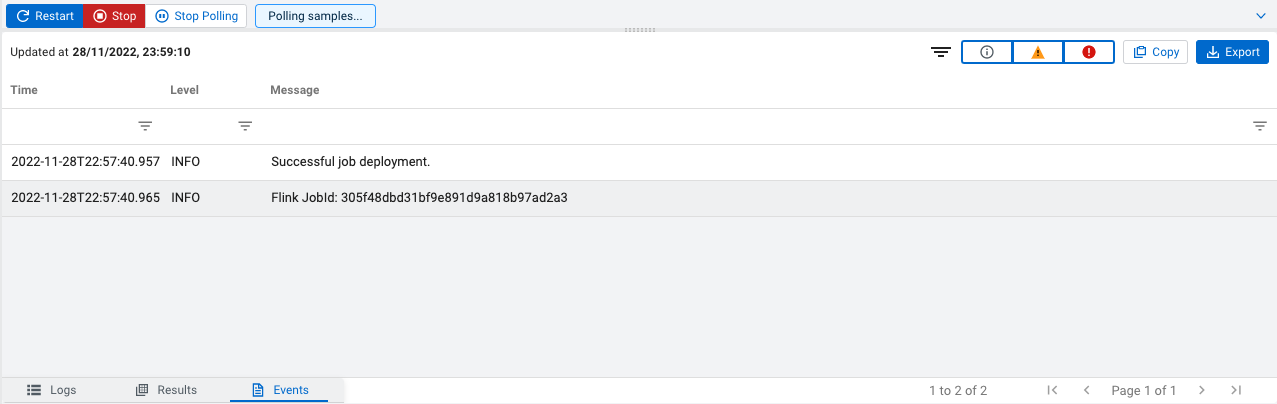
Click Events to check the job related information.