Learn how to enable end-to-end latency monitoring of Kafka topics using Streams
Messaging Manager (SMM). You need to edit the consumer.property and
producer.property files, start the producer in one terminal and the
consumer on another, and then open the SMM web UI for monitoring end-to-end
latency.
To enable the application start logging end-to-end latency metrics you use an
interceptor for the Kafka client, which can be set through the configuration
file.
Perform the following steps to enable the monitoring for the sample Java application
and verify the latency in SMM.
You must have set Ranger authorization policies.
-
Edit the
consumer.properties file and uncomment the following
line:
interceptor.classes=com.hortonworks.smm.kafka.monitoring.interceptors
.MonitoringConsumerInterceptor
-
Edit the
producer.properties file and uncomment the following
line:
interceptor.classes=com.hortonworks.smm.kafka.monitoring.interceptors
.MonitoringProducerInterceptor
-
Start the producer on one terminal window with the following command:
java \
  -cp ./target/kafka-client-avro-1.0-SNAPSHOT.jar \
  com.cloudera.examples.MachineDataProducer \
  ./producer.properties \
  ./src/main/avro/MachineData.v1.avsc
-
Start the consumer on another terminal window with the following command:
java \
  -cp ./target/kafka-client-avro-1.0-SNAPSHOT.jar \
  com.cloudera.examples.MachineDataConsumer \
  ./consumer.properties
-
Navigate to , and select the environment where your Kafka cluster is
running.
-
On the Data Hubs tab of your environment, select the
Kafka cluster you created.
-
Click Streams Messaging Manager on the Services pane to
open the SMM web UI.
-
On the SMM UI, click Overview (
 ).
).
-
Click on the profile icon (
 ) for the
 machine-data-avro topic
to open the topic page.
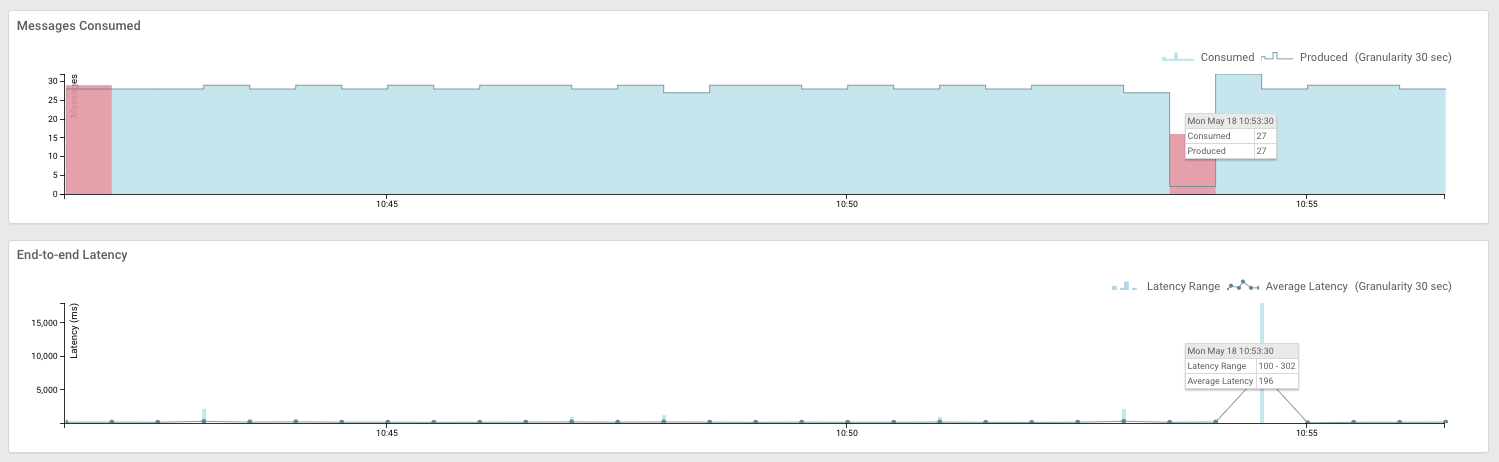
You see data in the charts Messages Consumed and
End-to-end latency. You may have to wait a few seconds
until the charts appear.
Refresh the page after some time to view the updated
data.