Monitoring Kafka activity in Streams Messaging Manager
You can use Streams Messaging Manager (SMM) to monitor Kafka activity. To do this, you run two SSH sessions, one for producing data to a Kafka topic and the other to consume the data from the Kafka topic. Then you go to the SMM UI from the Management Console to track the producer and consumer activity.
Now that you know how to configure a Kafka client to connect to the Kafka cluster in
CDP, generate some activity and monitor it using SMM. To do this, you collect
machine usage data from the broker host using the vmstat command
and stream that data into the machine-data topic.
For detailed and comprehensive information about SMM, see Streams Messaging Manager.
-
Click Streams Messaging Manager on the services pane to
open the SMM web UI.
It may take a few minutes for the consumer or producer activity to start showing in the SMM UI. You may have to refresh your page a few times until the data starts to appear.Once it does, you see one active producer on the left-hand side of the page and at least one active consumer listed on the right-hand side of the page.
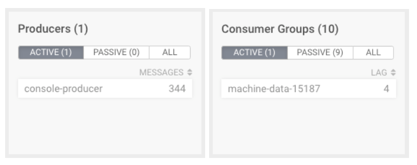
You also see the LAG metrics listed besides each consumer. This metric indicates the number of messages the consumer is behind the latest message produced to the Kafka topic. You can use this to quickly identify slow consumers that are lagging behind producers. -
Click either on the producer or on the consumer, and SMM shows their activity,
highlighting all the topics and partitions they are writing to or reading from,
respectively.
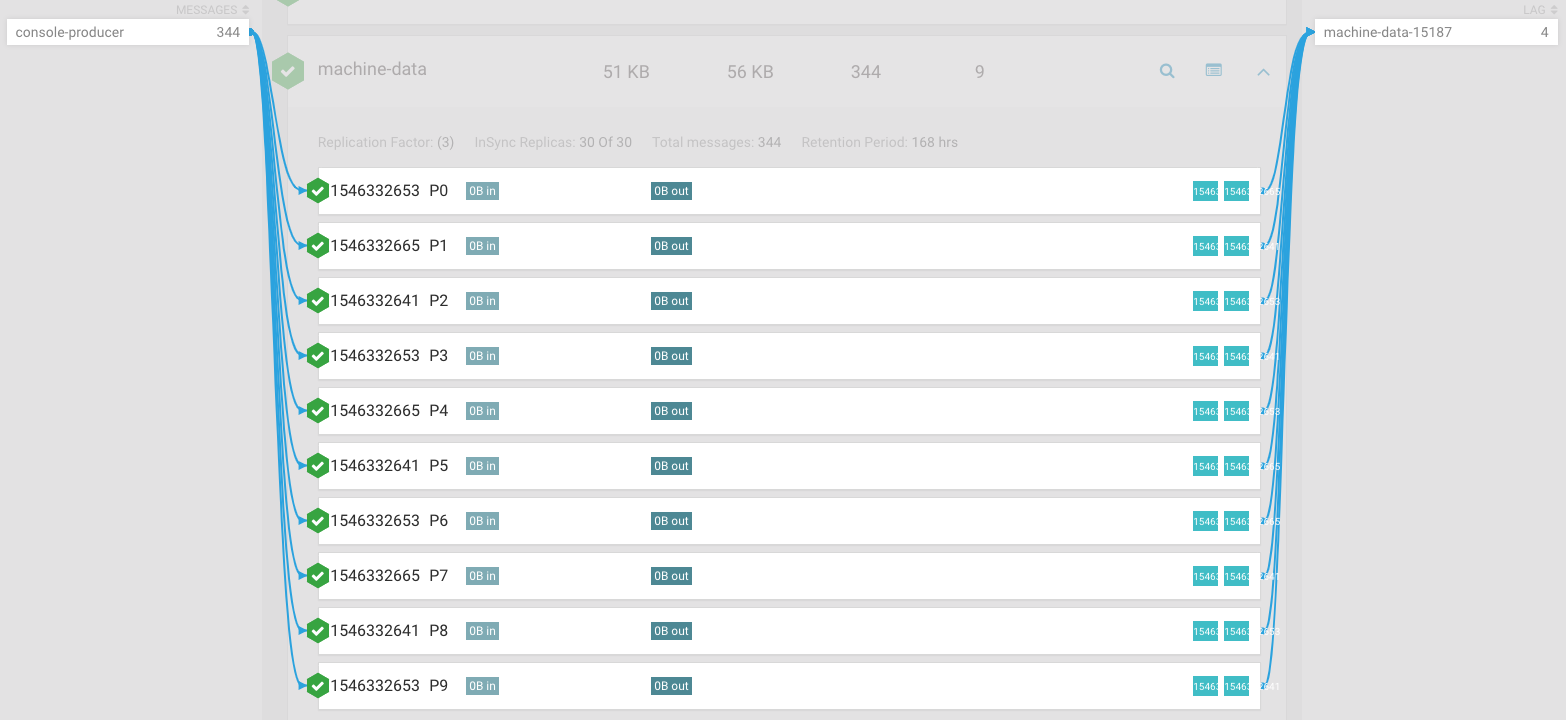
In this page you can identify metrics for the overall Kafka topic activity and partition-level. The In Sync Replica (ISR) set for each partition can be identified on the screen. The ID of the LEADER replica for each partition is shown on the left-hand side, while the FOLLOWER replicas are represented as teal-colored boxes on the right-hand side.
-
Click on an empty part of the page to clear the consumer or producer selection,
and then click the profile icon
 for the
 machine-datatopic.This opens the Kafka topic details page where you can find all the topic-related metrics and utilization charts.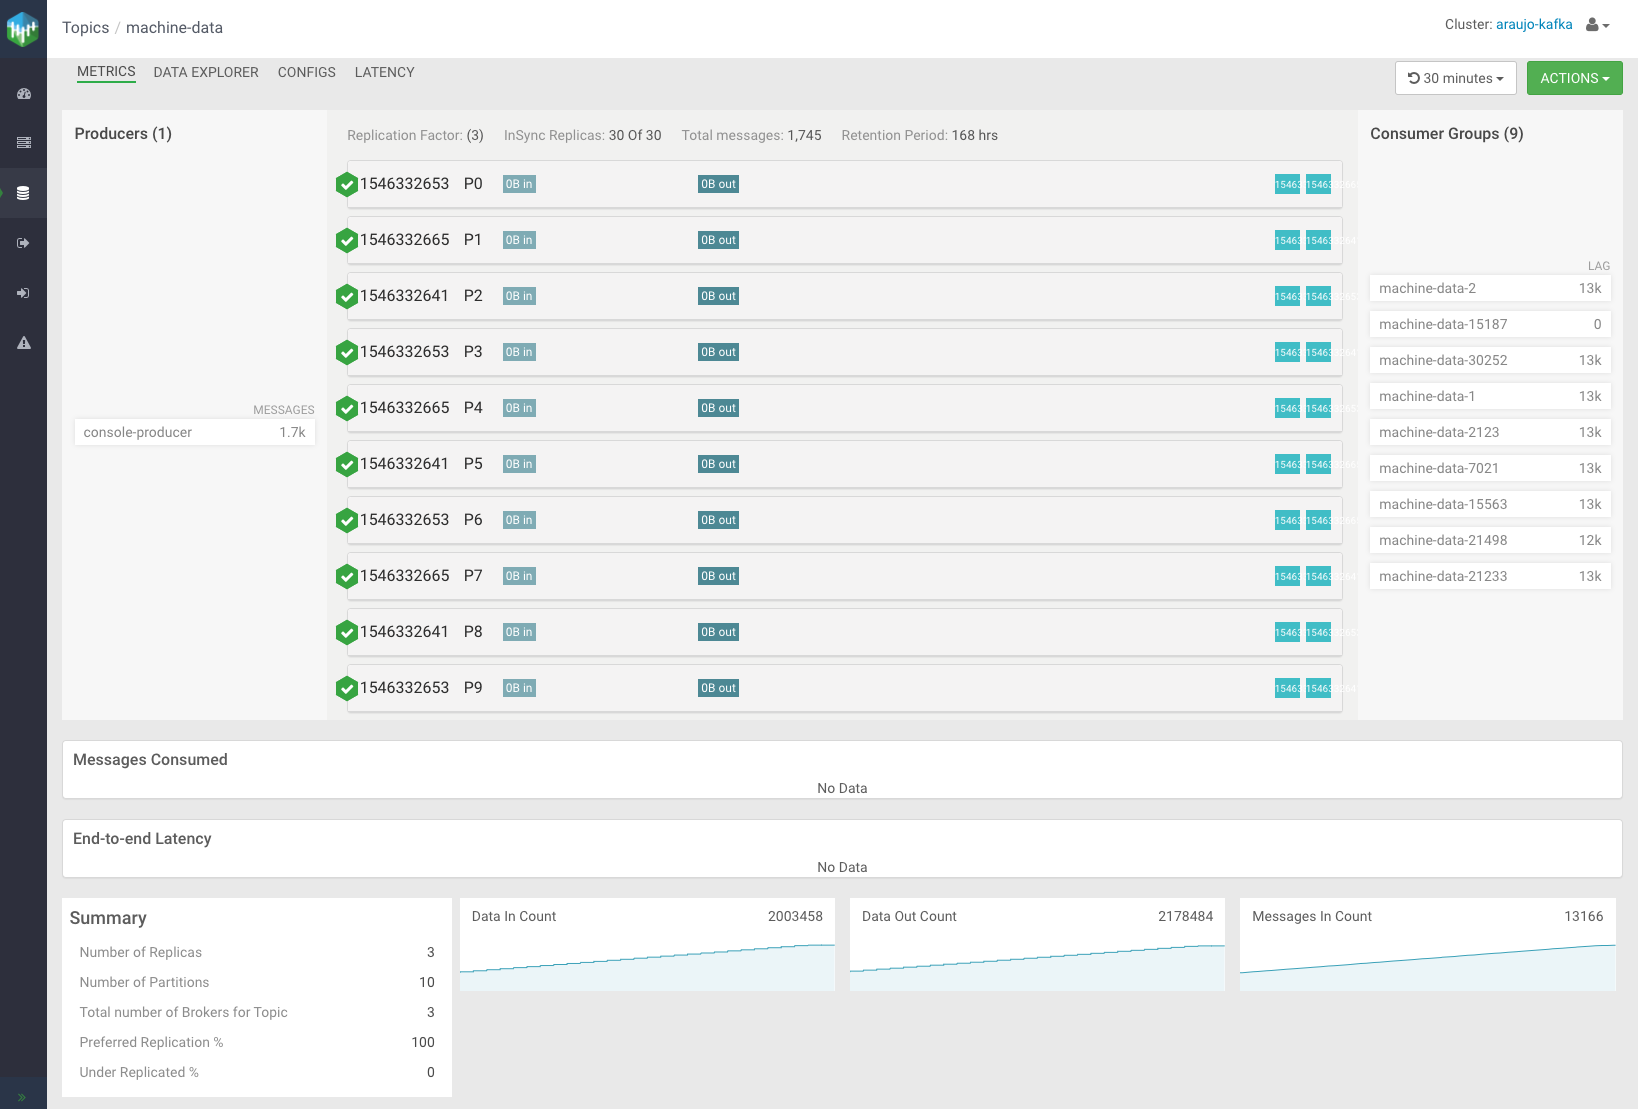
-
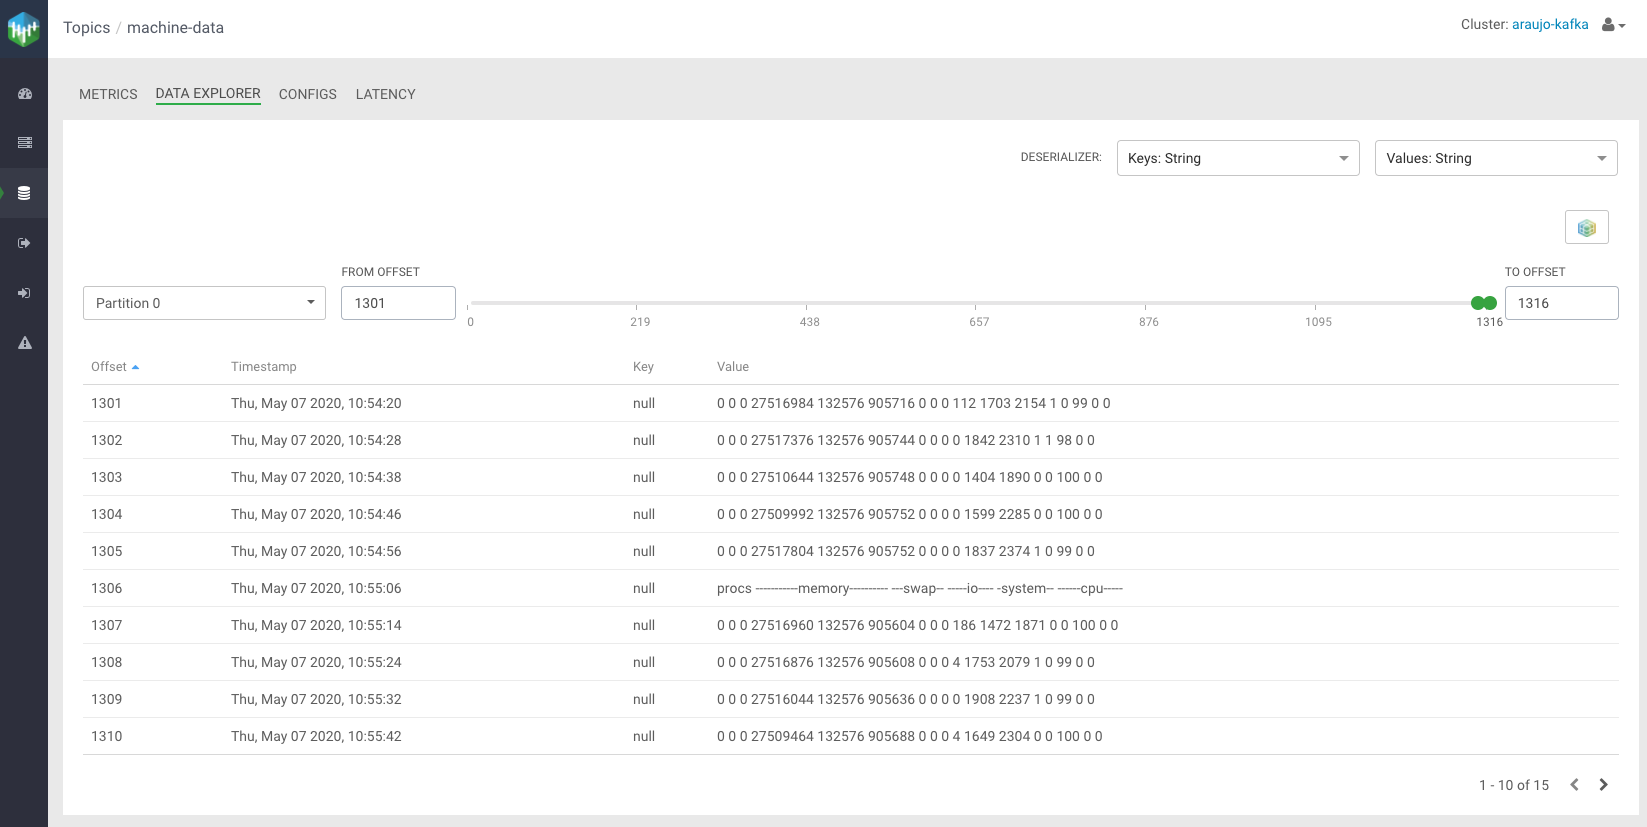
Click the DATA EXPLORER tab.
In the Data Explorer page you can sample the data that is flowing through the Kafka topic. Select different partitions and adjust the offset sliders to become familiar with those controls.