End to End Latency Use Cases
Let us walk through how SMM can answer some questions for a Platform Operations user:
Use Case 1: Verify whether end-to-end processing time SLAs are met.
A service-level agreement (SLA) is a commitment between a service provider and a service user. Particular aspects of the service are agreed between the service provider and the service user. The most common component of SLA is that the services should be provided to the user as agreed upon in the contract. For example, you agreed upon an average latency value and a maximum latency value for message consumption with Cloudera. Therefore, after a producer produces messages, if the messages take the agreed amount of time to be consumed by consumers, the SLA would be met.
- Go to Topics in the SMM UI.
- Select the topic you want to verify the details about.
- Click the Profile icon beside the topic you select.
- Check the latency graph and see if the average and maximum latencies are as expected.
- If the latencies are not as expected, go to the Latency tab.
- Check whether the number of clients is as expected. If not, then you might want to check the missing client instance.
- If the number of clients are as expected, then check if there is any spike in the message count. Select a period of 1 week in the Time Range pane and see if there is a surge in incoming messages that could explain the time SLA violation.
- If the time SLA appears to be breached even after all the checks turned positive, go to Use Case 2.
Use Case 2: Identify slow or lagging consumers.
- Go to Topics in the SMM UI.
- Select the topic you want to verify the details about.
- Click the Profile icon beside the topic you select.
- Go to the Latency tab.
- After you select a group, inspect the latency and message counts for each
client.
This could lead you to the slow consumer.
Let us walk through an example.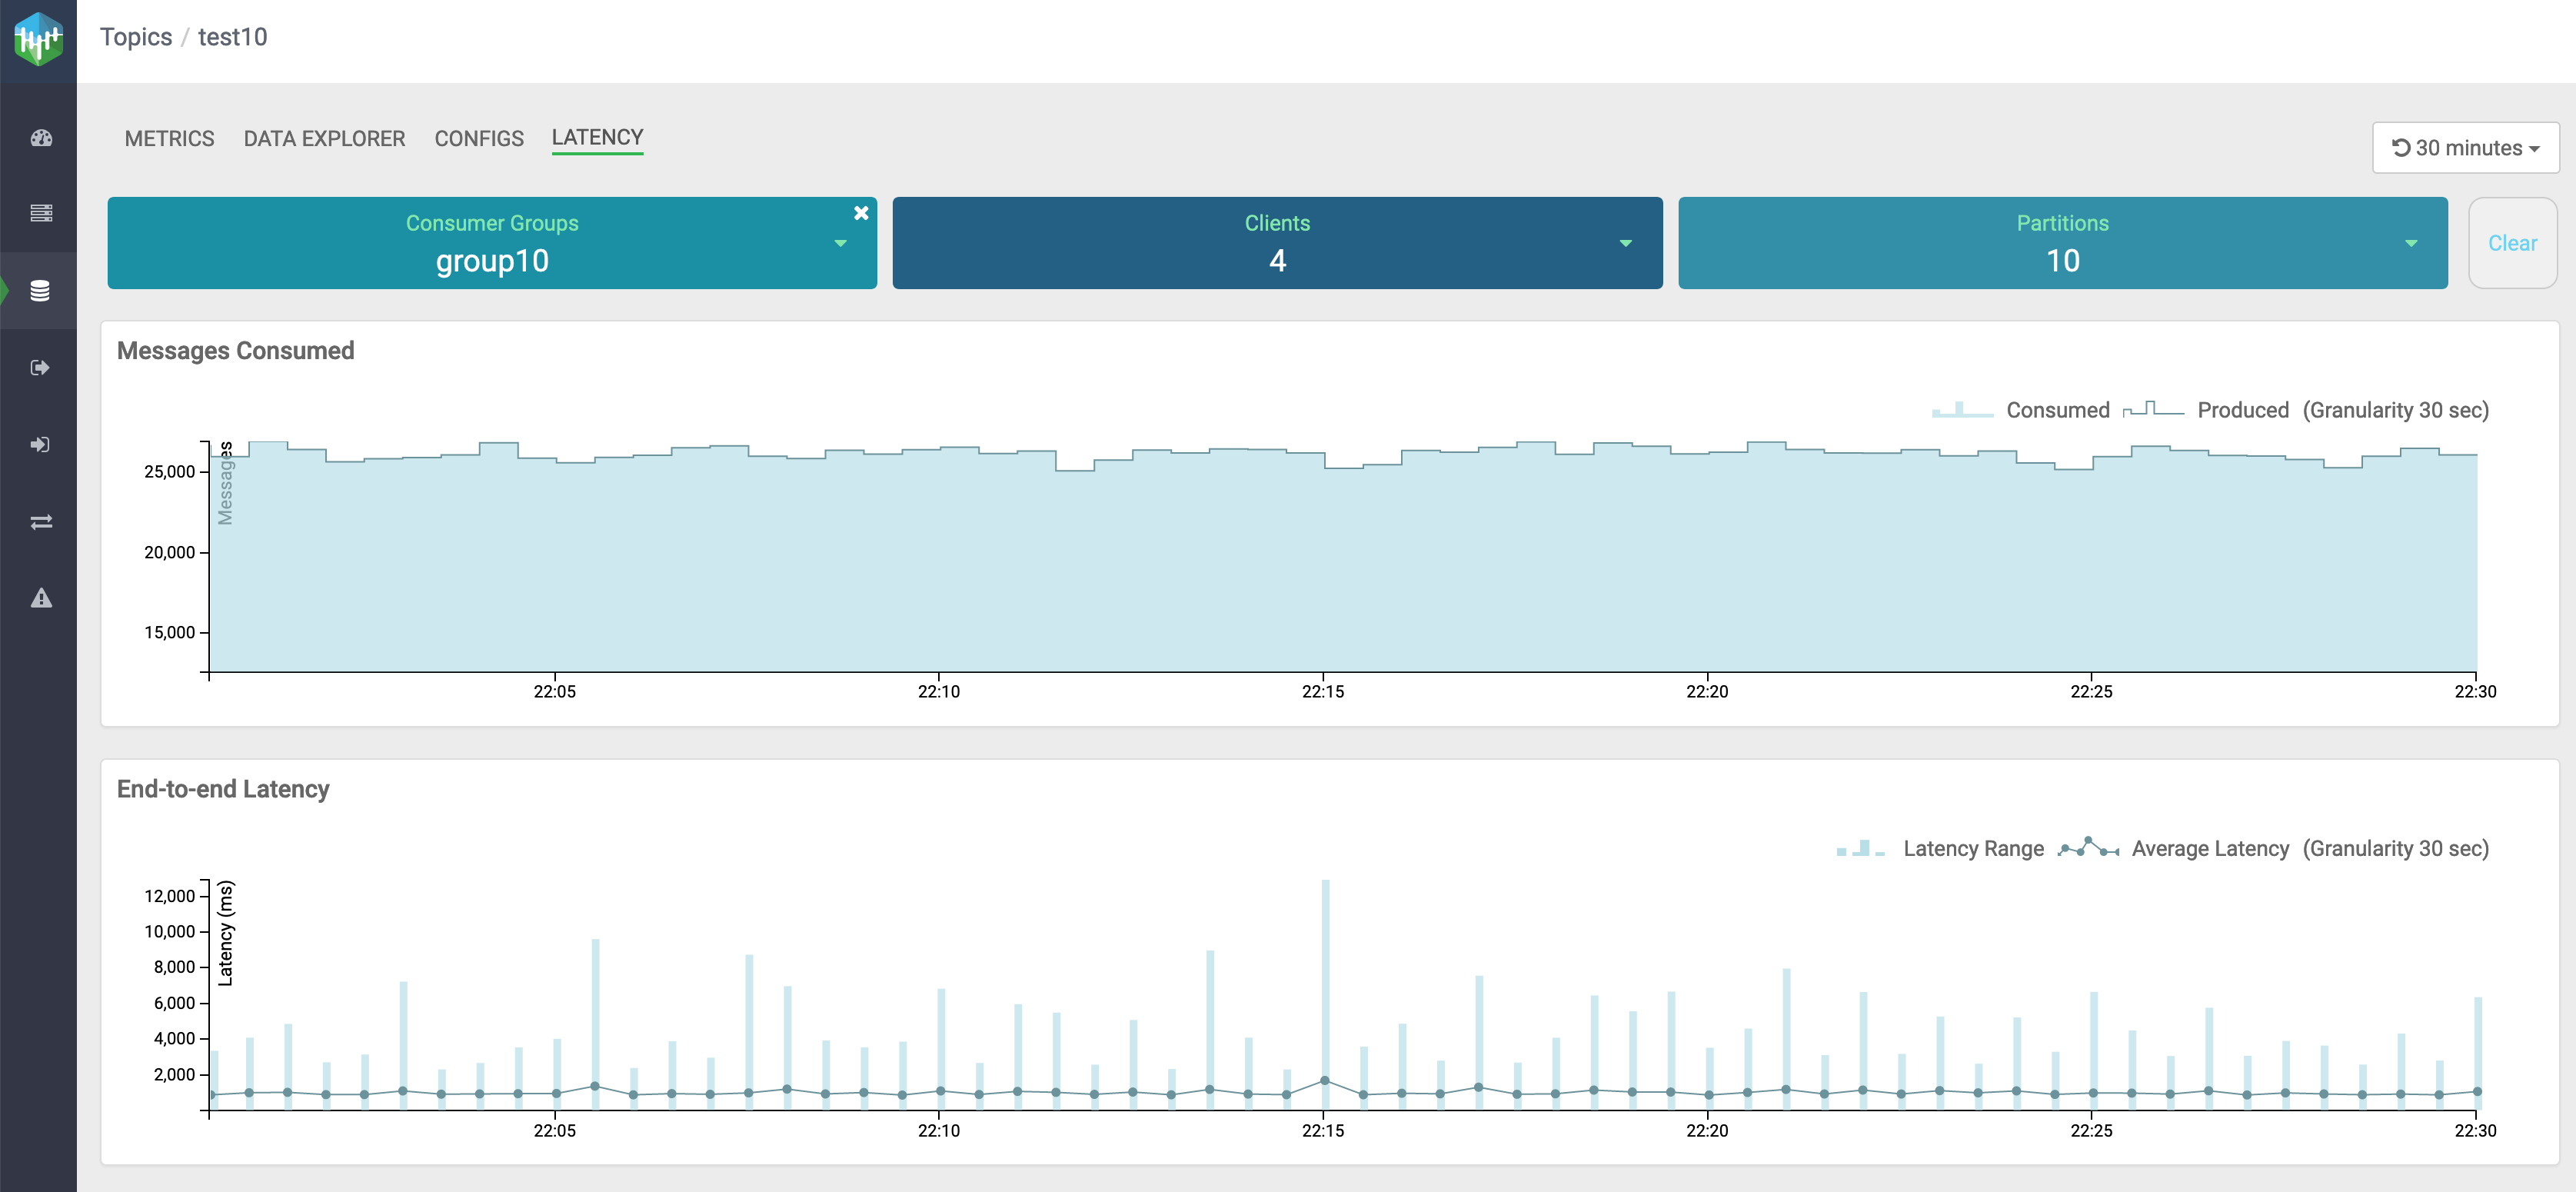
In the above image, you select group10 consumer group to inspect the latency and message counts for each client.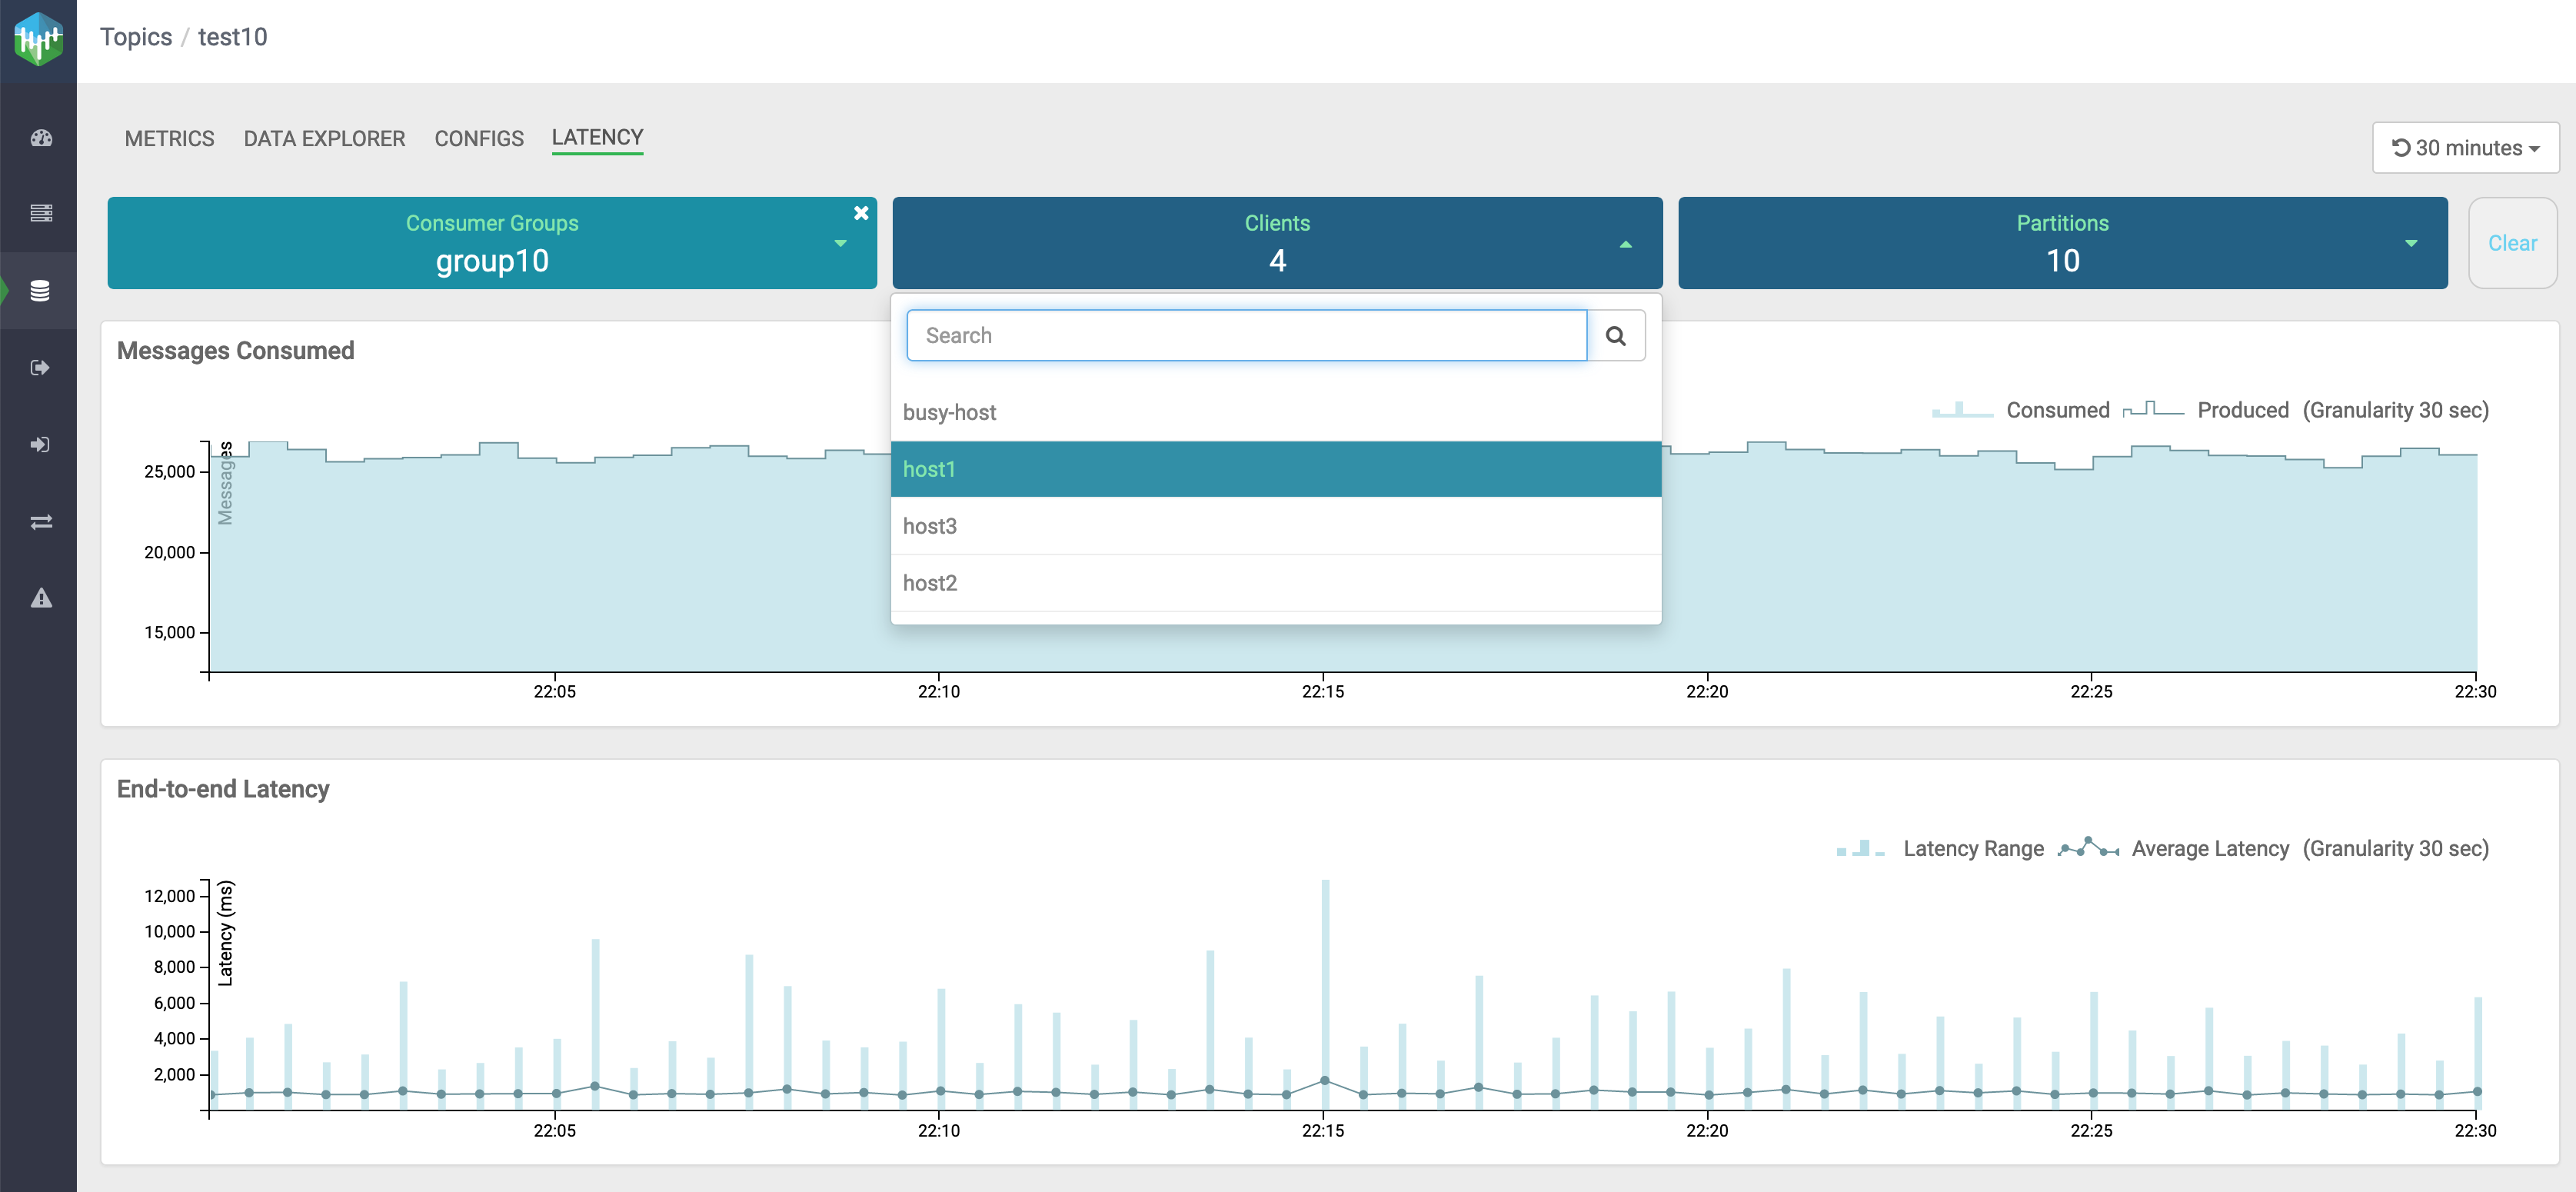
In the above image, you see the list of active clients for group10: host1, host2, host3, and busy-host. Now you need to select each client and inspect the latency and message counts.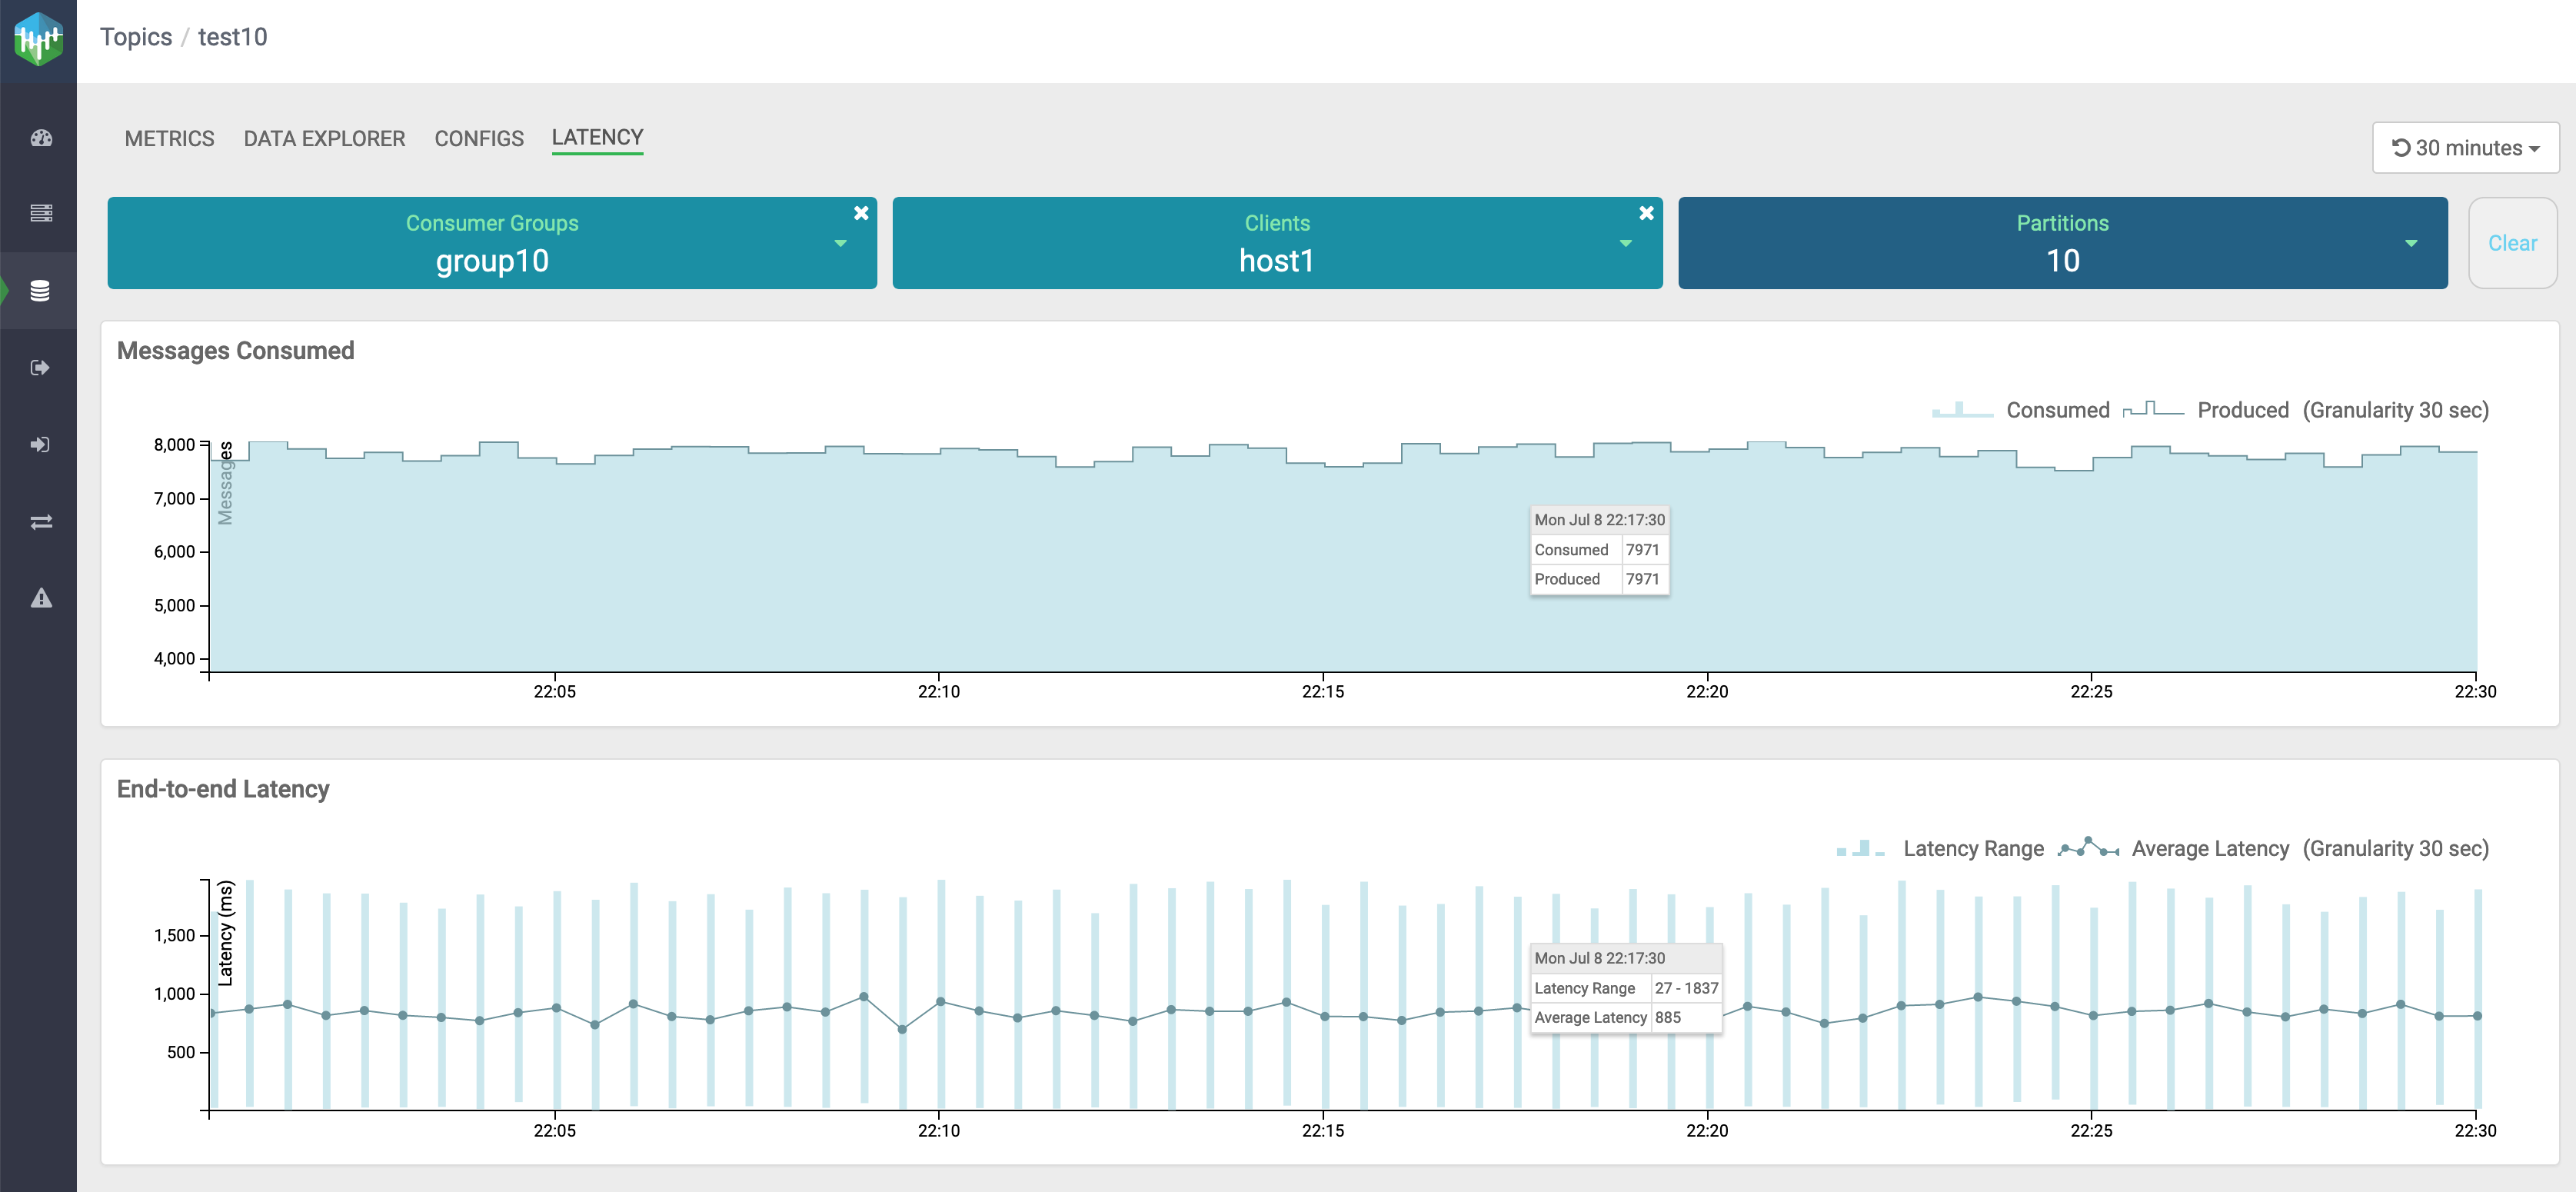
In the above image, you can see that host1 consumed all the messages produced, and the average latency and latency range are under a good range.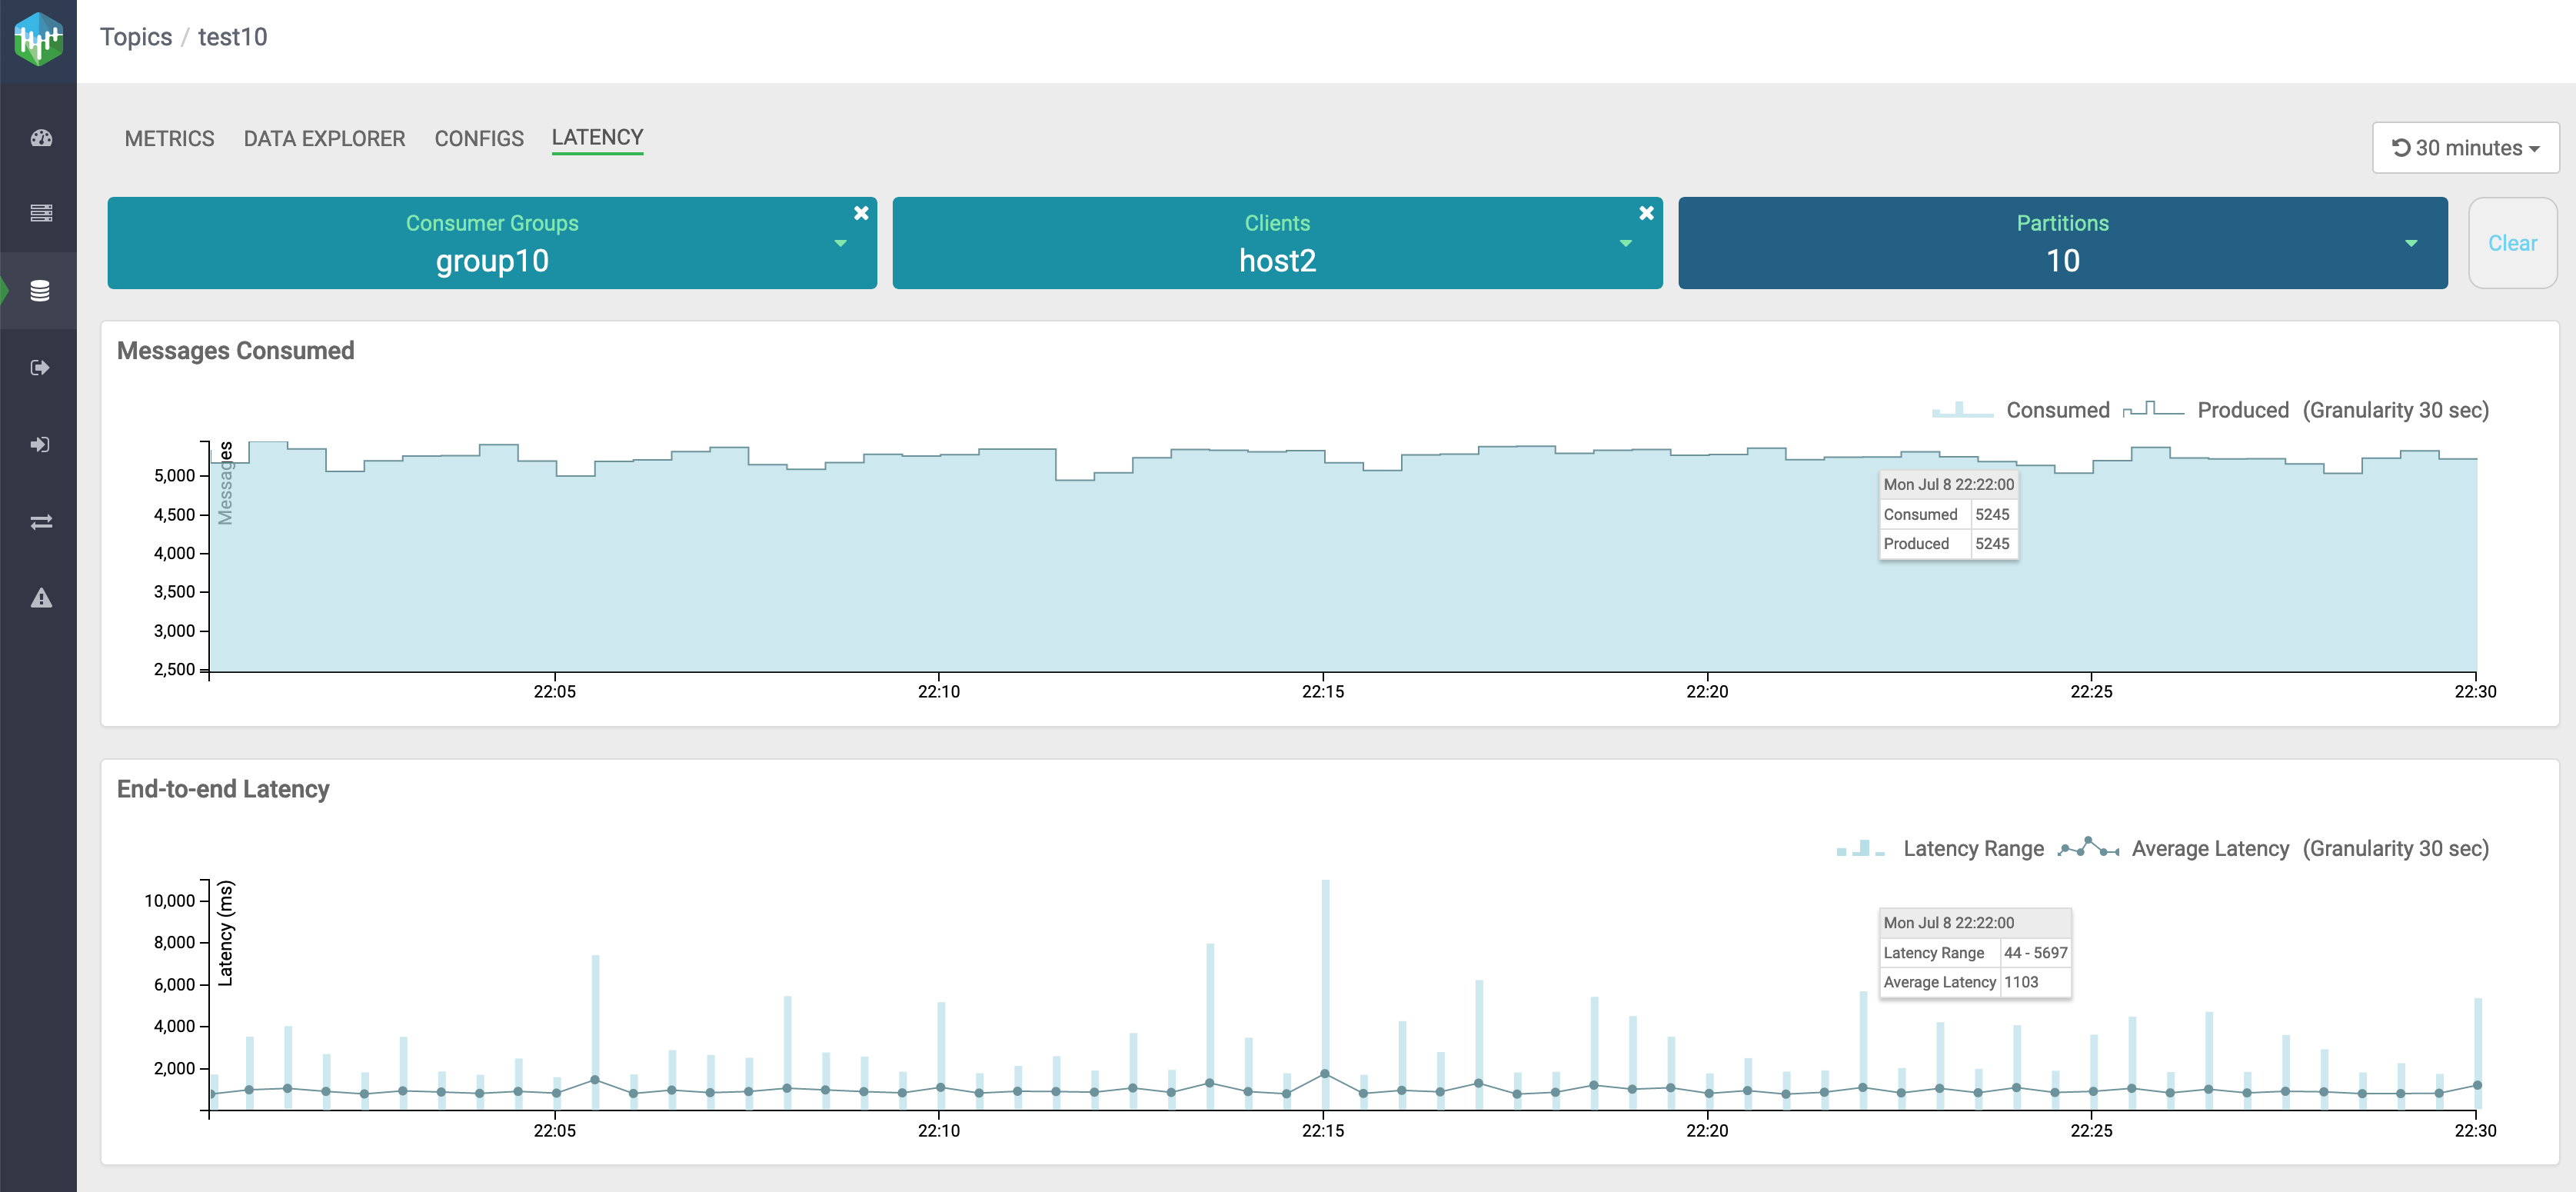
In the above image, you can see that host2 consumed all the messages produced. Also, there are few spikes in latency range, but the average latency is under a good range.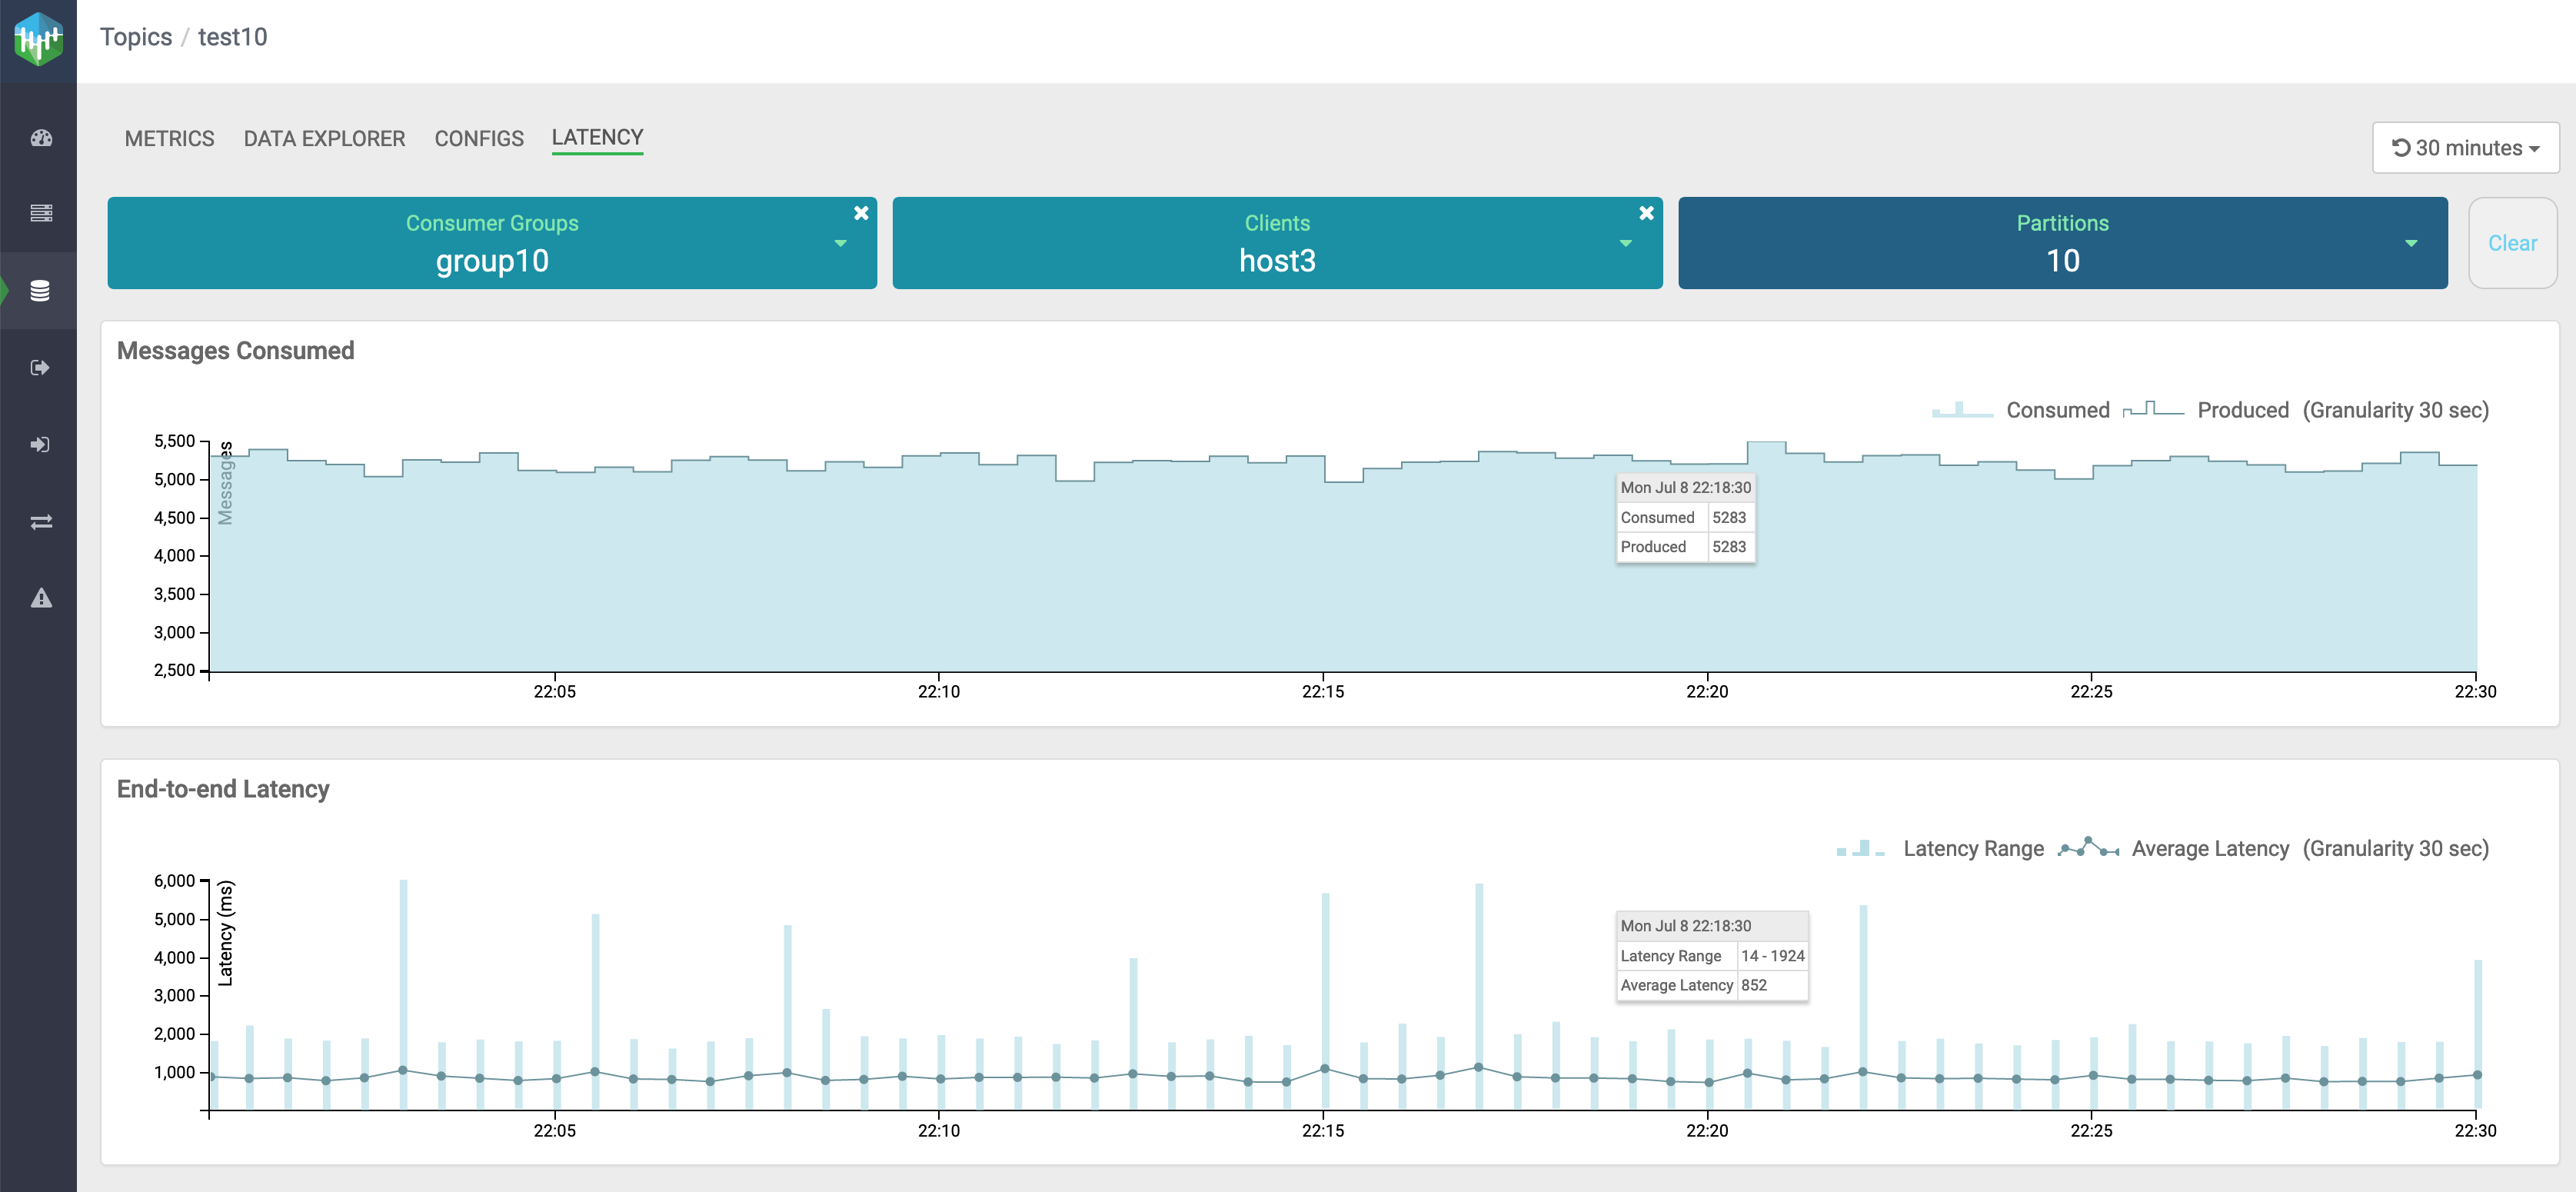
In the above image, you can see that host3 consumed all the messages produced. Also, there are occasional spikes in latency range, but the average latency is under a good range.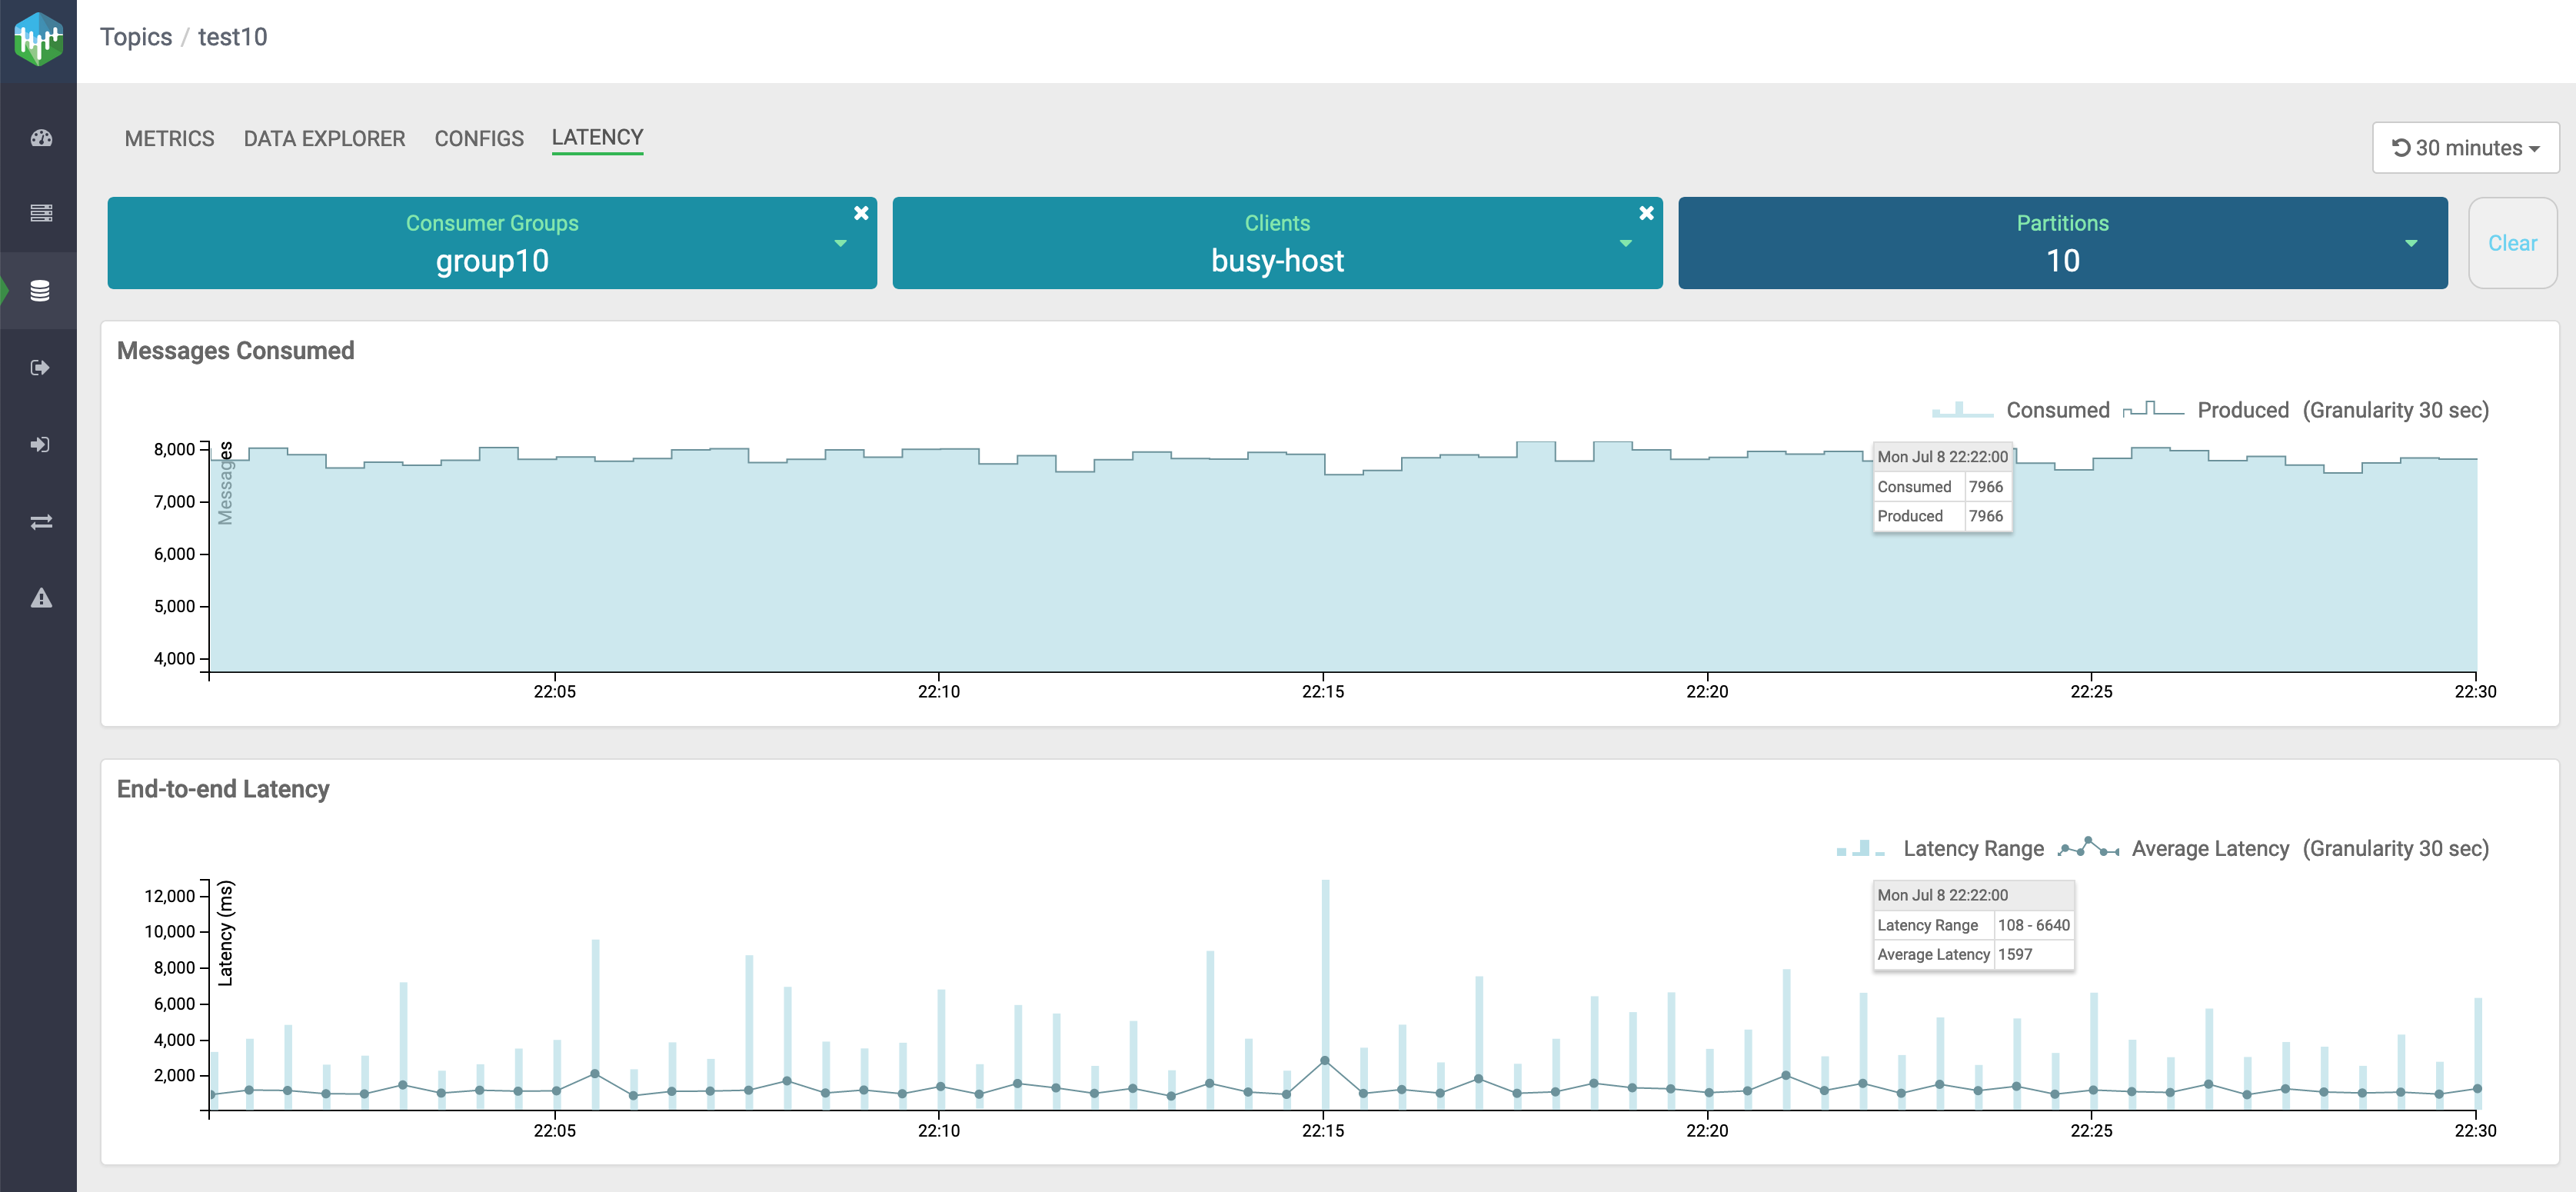
In the above image, you can see that busy-host consumed all the messages produced. There are frequent spikes in latency range, and both latency range and average latency are high. Hence, busy-host is the slow consuming client.
It is possible that all the clients are experiencing longer latencies. This could imply that there is a common bottleneck. For example, clients are interacting with external store over network and having delays in consuming the messages due to network issues.
If there is a single client that is experiencing slowness, you must check the message counts for other clients, and system parameters like CPU and memory.
This addresses your need to identify the slow consuming application.
Use Case 3: Verify whether messages are overconsumed or underconsumed.
- If the producers and consumers are shut down in an unclean manner or the producers and consumers went down in an unexpected manner. For example, Kafka producer produced some messages but it shut down before the producer received any acknowledgement from the broker. Similarly, Kafka consumer consumed a few messages but got shut down before it could commit the offset at this latest point.
-
If the consumer is reset to an older offset (reprocessing scenarios).
- Go to Topics in the SMM UI.
- Select the topic you want to verify the details about.
- Click the Profile icon beside the topic you select.
- Go to the Latency tab.
- After you select a group, inspect the produced message and consumed message counts for
each client in Messages Consumed graph.This helps you to verify whether the consumers are consuming all the messages that are produced in a topic. You might also identify occurrences of any overconsumption or underconsumption of messages.
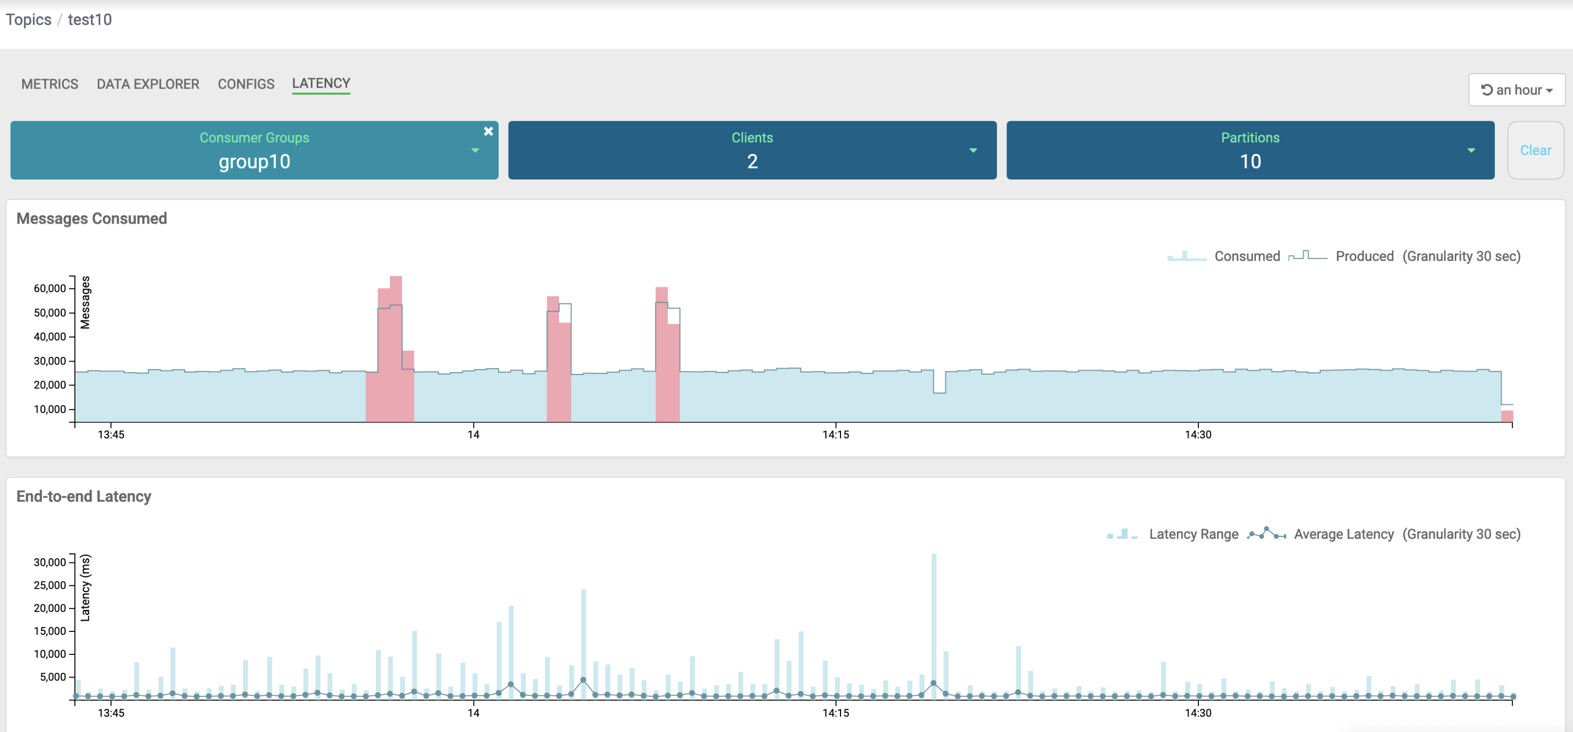
In the image, you can see that for group10 consumer group, there are three red spikes in the
Messages Consumedgraph.The first spike, from the left, indicates that the number of consumed messages is more than the number of produced messages. So, this is an overconsumption of messages.
The second and the third spike indicate overconsumption of messages followed by an underconsumption of messages.