Monitoring End-to-end Latency
Perform the following steps to monitor end-to-end latency in the SMM UI:
-
Click the Profile icon
 beside the
topic you select.
beside the
topic you select.
This takes you to the Metrics page where you can find the Messages Consumed and End-to-end Latency graphs along with other topic details. On the Metrics page, these two graphs provide you an aggregated result of latency and count of consumed messages across all consumer groups.
-
To verify the details by individual consumer groups, clients, and partitions,
go to the Latency tab.
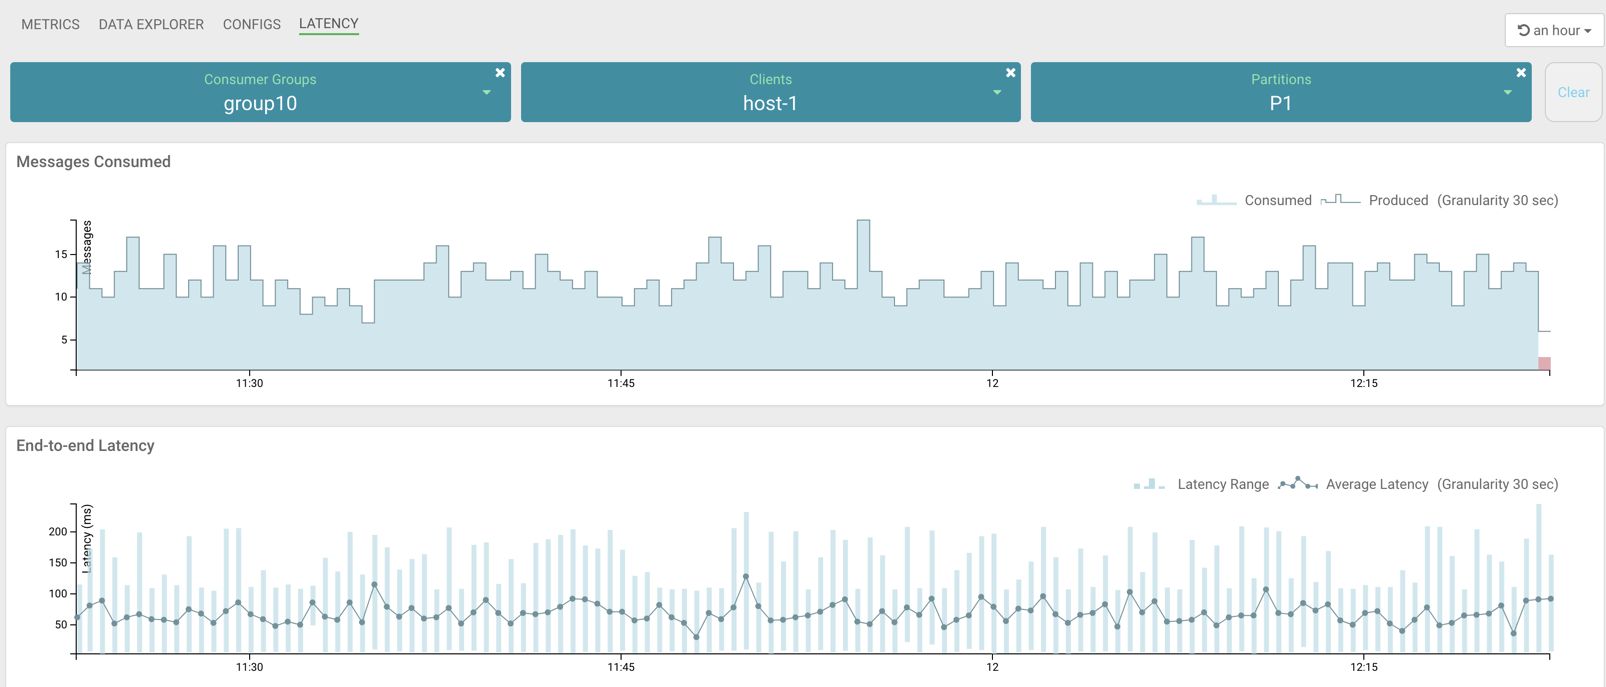
The Latency page appears as shown in the following image:
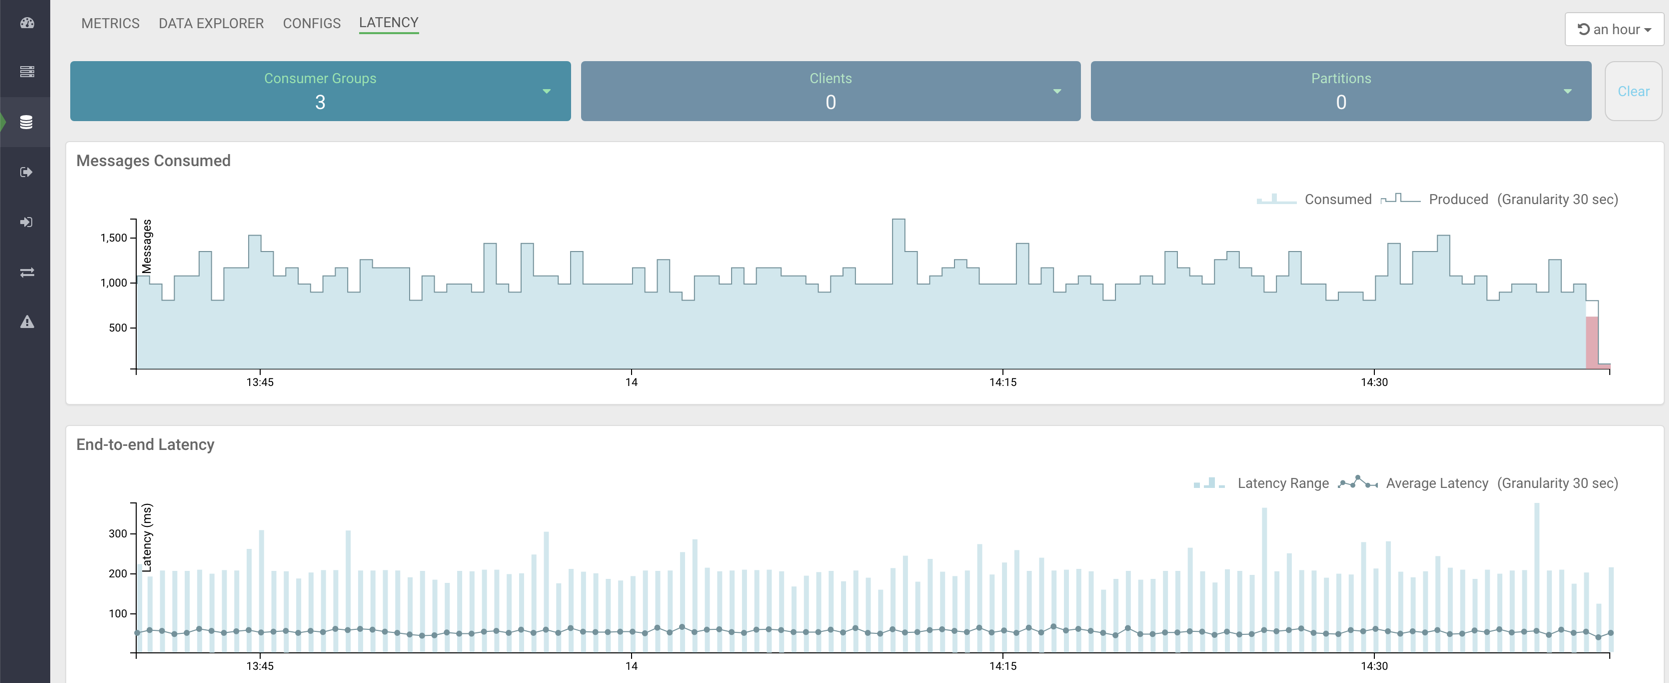
The Latency view gives you a powerful snapshot of the end-to-end latency scenario: number of consumer groups for a topic, number of clients inside a particular consumer group, and number of partitions in a topic along with the
Messages ConsumedandEnd-to-end Latencygraphs. -
Select any consumer group from the Consumer Groups
drop-down, as shown in the following image:
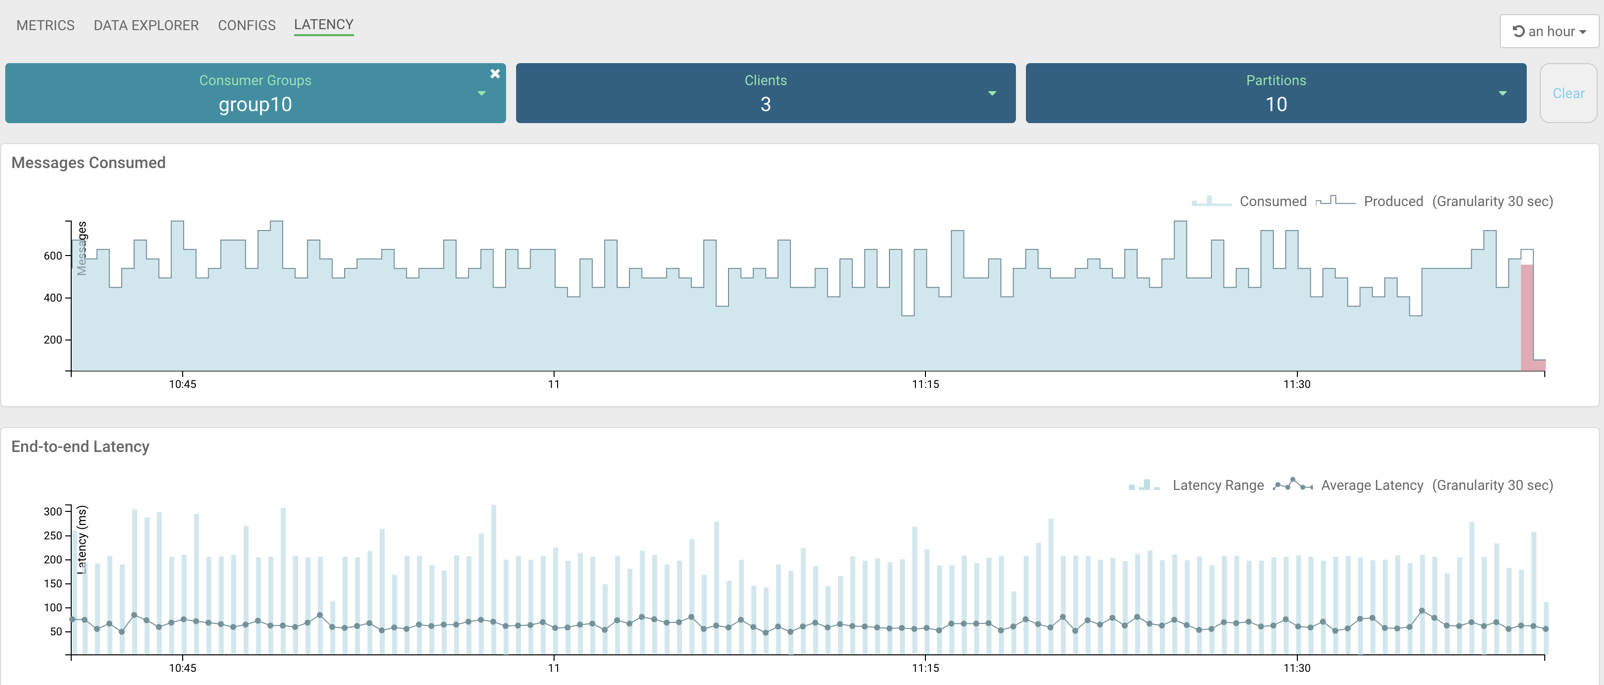
In the image, group10 consumer group is selected. The
Latencytab displays that there are 3 clients in the group10 consumer group, and 10 partitions are available in the topic. -
Select any client from the Clients drop-down, as shown
in the following image:
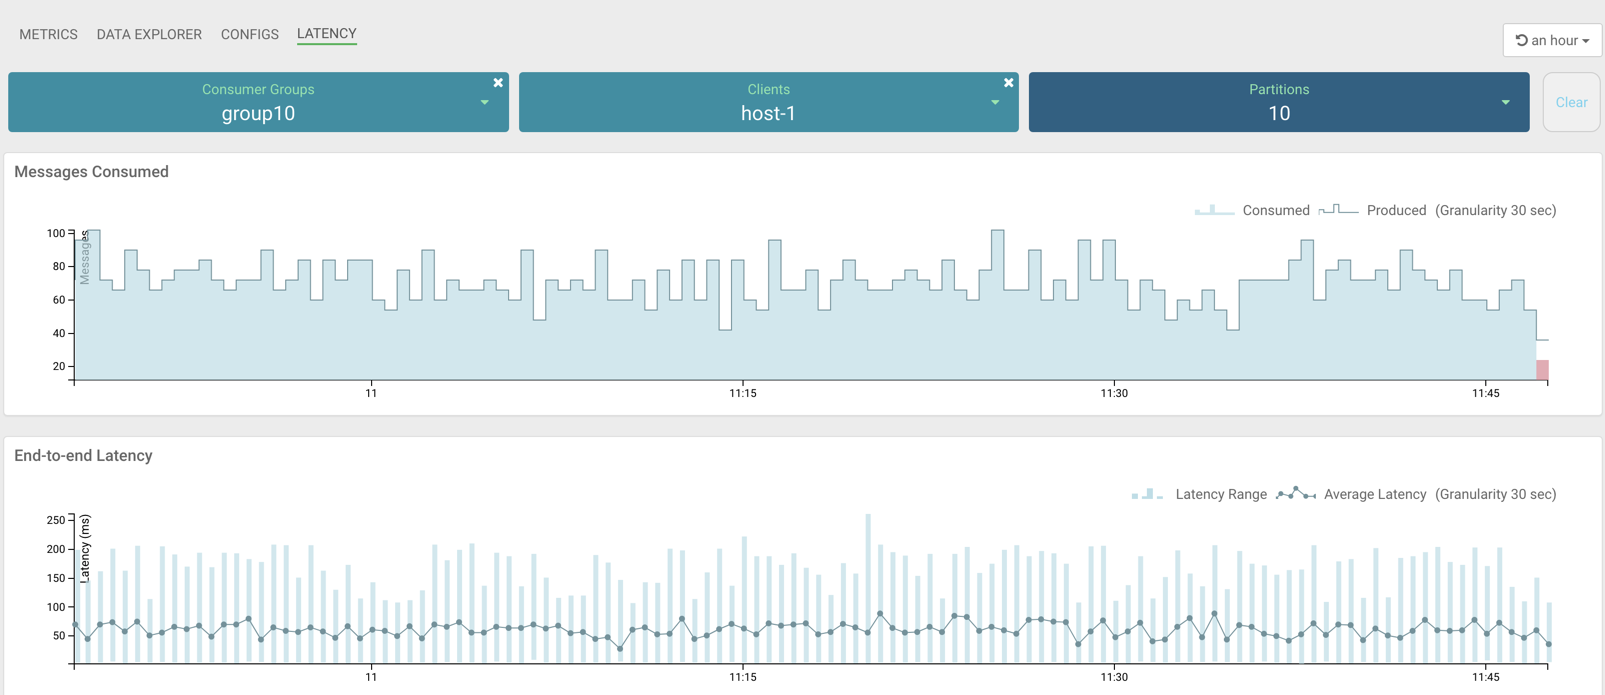
In the image, host-1 client is selected. At this instance, the Messages Consumed and End-to-end Latency graphs display data for only the host-1 client. Here you can monitor the number of messages produced, number of messages consumed, latency range, and average latency for host-1 only. Hover your mouse over the graphs and get data at any point of time in the selected time range. You can see in the Messages Consumed graph that host-1 consumed all the messages that are produced and actively consuming data at the latest time. You can see in the End-to-end Latency graph that the latency range and average latency are under 250 milliseconds.
-
To get details about the partitions from where host-1 is consuming data, click
Partitions.
The list of partitions in the topic appears, as shown in the following image:
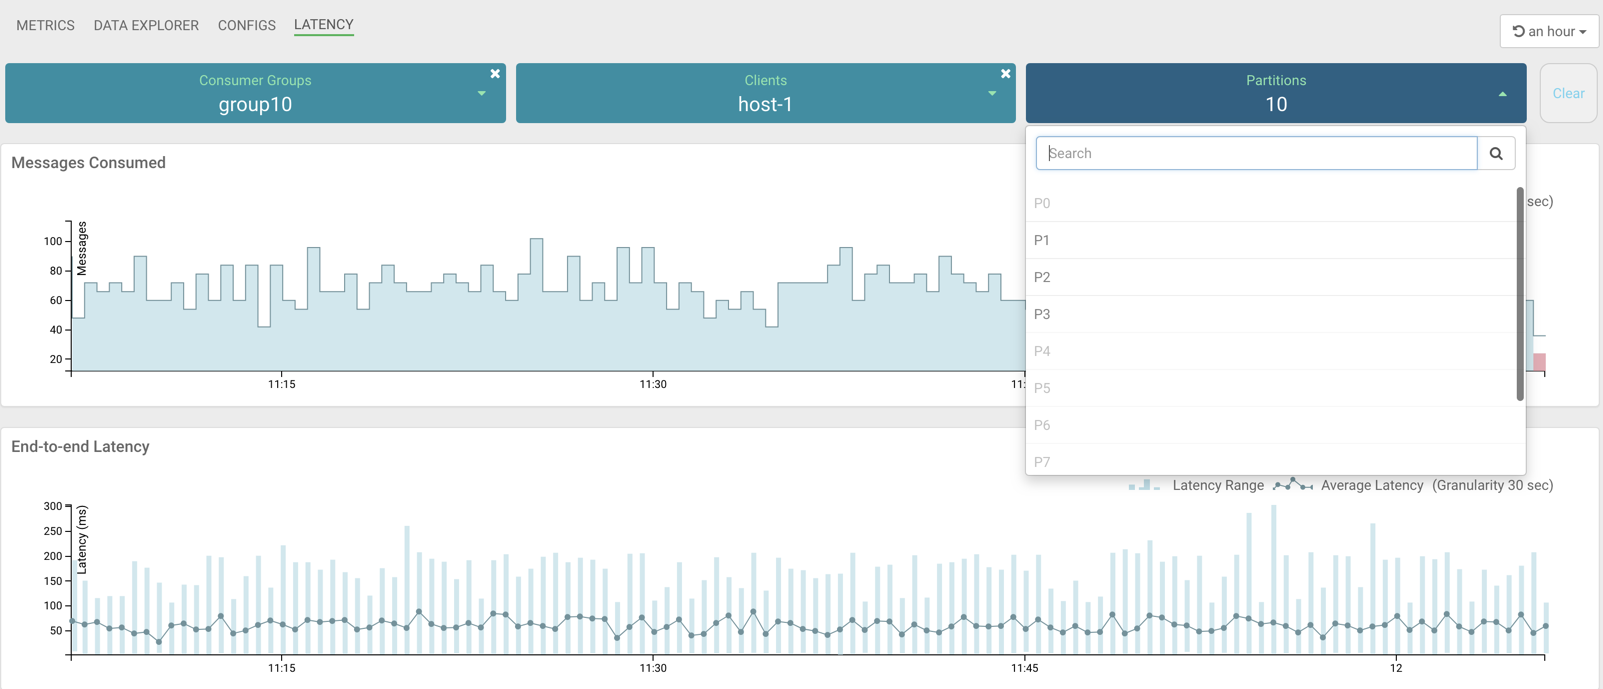
In the image, you can see that host-1 is consuming data from 3 partitions: P1, P2, and P3. Other partitions are inactive for host-1.
-
Select any active partition from the list.
The Latency tab displays the transaction details between host-1 and the selected partition (for example, P1), as shown in the following image:
Now you have got details for host-1 client. Likewise, you can fetch details for other clients.
-
Follow steps 5 through 8 to fetch data for all other consumer groups.
-
To clear all the selections at once, click the Clear button at the top-right corner of the page.
-
To clear selection for Consumer Groups, Clients, or Partitions, click the delete icon located on each drop-down.
-
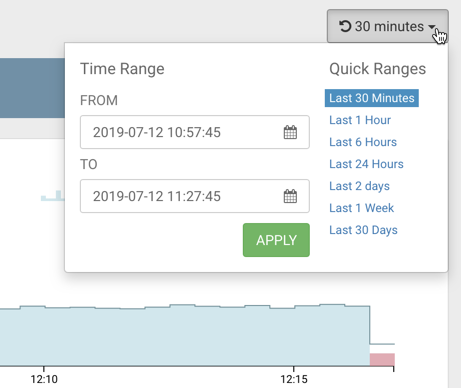
To select a different time range, use the Time Range and Quick Ranges options at the top-right corner of the page, as shown in the following image:
-