How DAS helps to debug Hive on Tez queries
Data Analytics Studio (DAS) provides a comprehensive framework to analyze and debug Hive and Hive on Tez queries. Using the query recommendations, Explain Plan, Directed Acyclic Graph (DAG) information, task attempts, and DAS logs, you can debug why a certain query failed to run or is taking longer than expected.
Understanding how Hive on Tez queries are executed
When you run a complex query from DAS, the query is executed on the Hive engine. In the first stage, a Directed Acyclic Graph (DAG) is created. It constitutes the time taken to compile, parse, and build the DAG for the next phase of the query execution. In the next stage of query execution, the DAG which is generated in Hive is submitted to the Tez engine for execution.
Tez is the default execution engine for Hive. When you run a complex query, Tez creates vertices (mappers and reducers) to provide results. The task and event details are written into the Tez logs. Tez writes the task and event details into a history file and Hue reads the history files to generate DAGs. Tez schedules tasks in such a way that the long-running tasks are run first and the shorter ones are scheduled to run later.
In the post-execution stage, the HDFS files are moved or renamed. The DAG Runtime shows the time taken by the Tez engine to execute the DAG.
What do you need to analyse and debug a query?
The crux of the query execution lies in the time taken by mappers and reducers and all tasks within them. When you are debugging a query to optimize its performance, you look into the vertex that took the longest time to run.
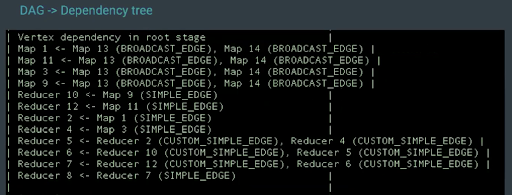
- Broadcast: sends the same data to every node
- Simple edge: sorts the data and sends it to the reducer
- Custom simple edge: sends data without sorting it
Using this information to troubleshoot Hive on Tez queries is a complex task requiring technical expertise. On older platforms, you could use Tez UI. On CDP, Cloudera recommends you to use DAS to debug queries. DAS provides a web interface to compose and run queries, shows intelligent query recommendations to optimize performance, query comparison, and other visual tools such as DAG info, DAG flow, visual explain plan, query timeline, and so on to debug queries.
Analyzing queries using DAS
After you run a query, go to the Query Details page. If there are any query recommendations on the top of the page, implement those in your query.
| Field | Description |
|---|---|
| Query ID | This is the Hive query ID |
| User | The user who ran the query |
| Status | The status of the query, whether it passed (success), failed, or is in progress (running) |
| Start time | The time when the query execution started |
| End time | The time when the query execution completed |
| Duration | Total time taken to execute the query |
| Tables read | Comma-separated list of Hive tables that were read while executing the query |
| Tables written | Comma-separated list of Hive tables to which the data was written while executing the query |
| Application ID | The YARN application ID, which can be used to investigate a query issue related to a YARN application |
| DAG ID | The DAG ID of the query that is run, which is also present in the application log |
| Session ID | The Tez session used through HiveServer2 (HS2) Application Master that you are working on |
| Thread ID | The thread that is used to process the request on HS2. You can correlate a query in a thread at the time when it is running on HS2. |
| Queue | The queue that is used for the Tez job. Currently, the Capacity Scheduler is the
default scheduler. If no queues are configured, the default queue is used, which means that
100% of the cluster capacity is used to run Tez jobs. You can use the
|
To get information about the cluster ID and the HS2 instance to which you are connected, click the user icon on the top right corner of the page and select About.
By default, queries from the past 30 days are displayed on the Queries page. You can narrow down the queries run by a user within a specific time range by clicking the LAST 30 DAYS button on the search bar.
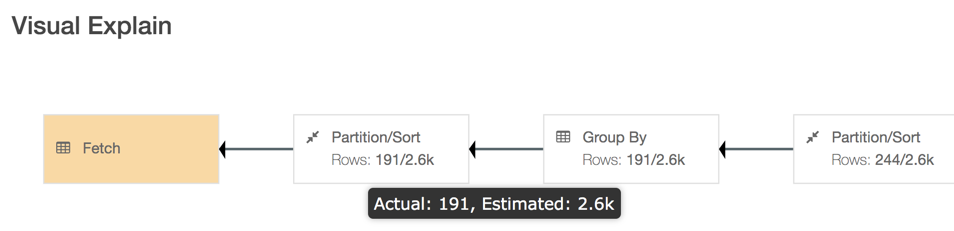
The Visual Explain plan must be read from right to left. This is the DAG of how the query tasks are executed. You can get additional details that were captured while executing the query by clicking the boxes in the Visual Explain plan.
Next, check the Timeline section. It provides a break-up of the time taken to compile and parse the query, and build, submit, and run the DAG. This helps you to analyze query wait times. You can then go to the DAG INFO section to see which map or reducer has a dependency on other vertices and is consuming more time, and in turn resources.
For example, in the following image, Map 1 consumes maximum time. Reducer 2 waits for an input from Map 1, and Reducer 3 depends on Reducer 2 for input:
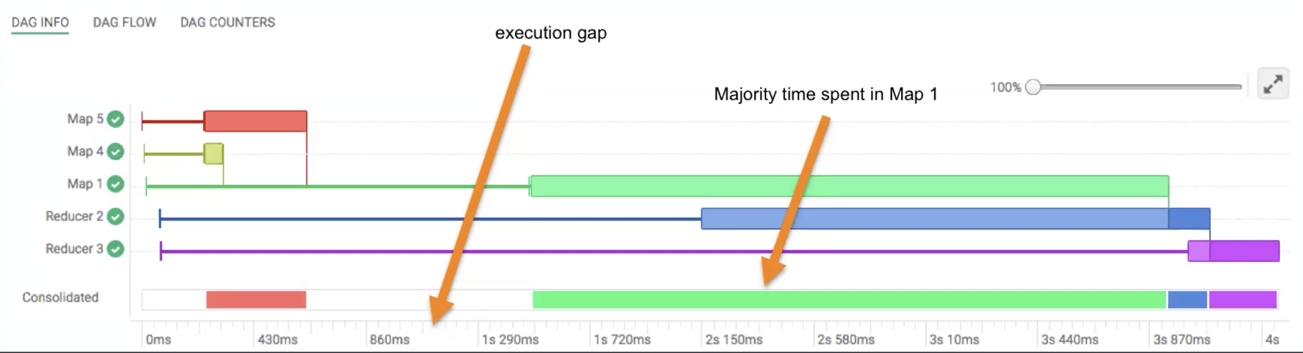
The vertical lines connecting two vertices denote the dependency of one vertex on another. The lightly shaded part of the horizontal bar indicates that a vertex is waiting for an input from the other vertex. The darker part of the bar indicates the actual execution time for that task. The vertical lines indicate the time when the vertex initialized, the time when the vertex started, the time when the first task started, the time when the last task completed, and the time when the vertex finished its execution. When you hover your mouse over the vertical line, the bubble displays the stage of the vertex execution and provides a timestamp.
If you fix the white space (the execution gap) on the Consolidated bar, you can optimize this query to complete faster.
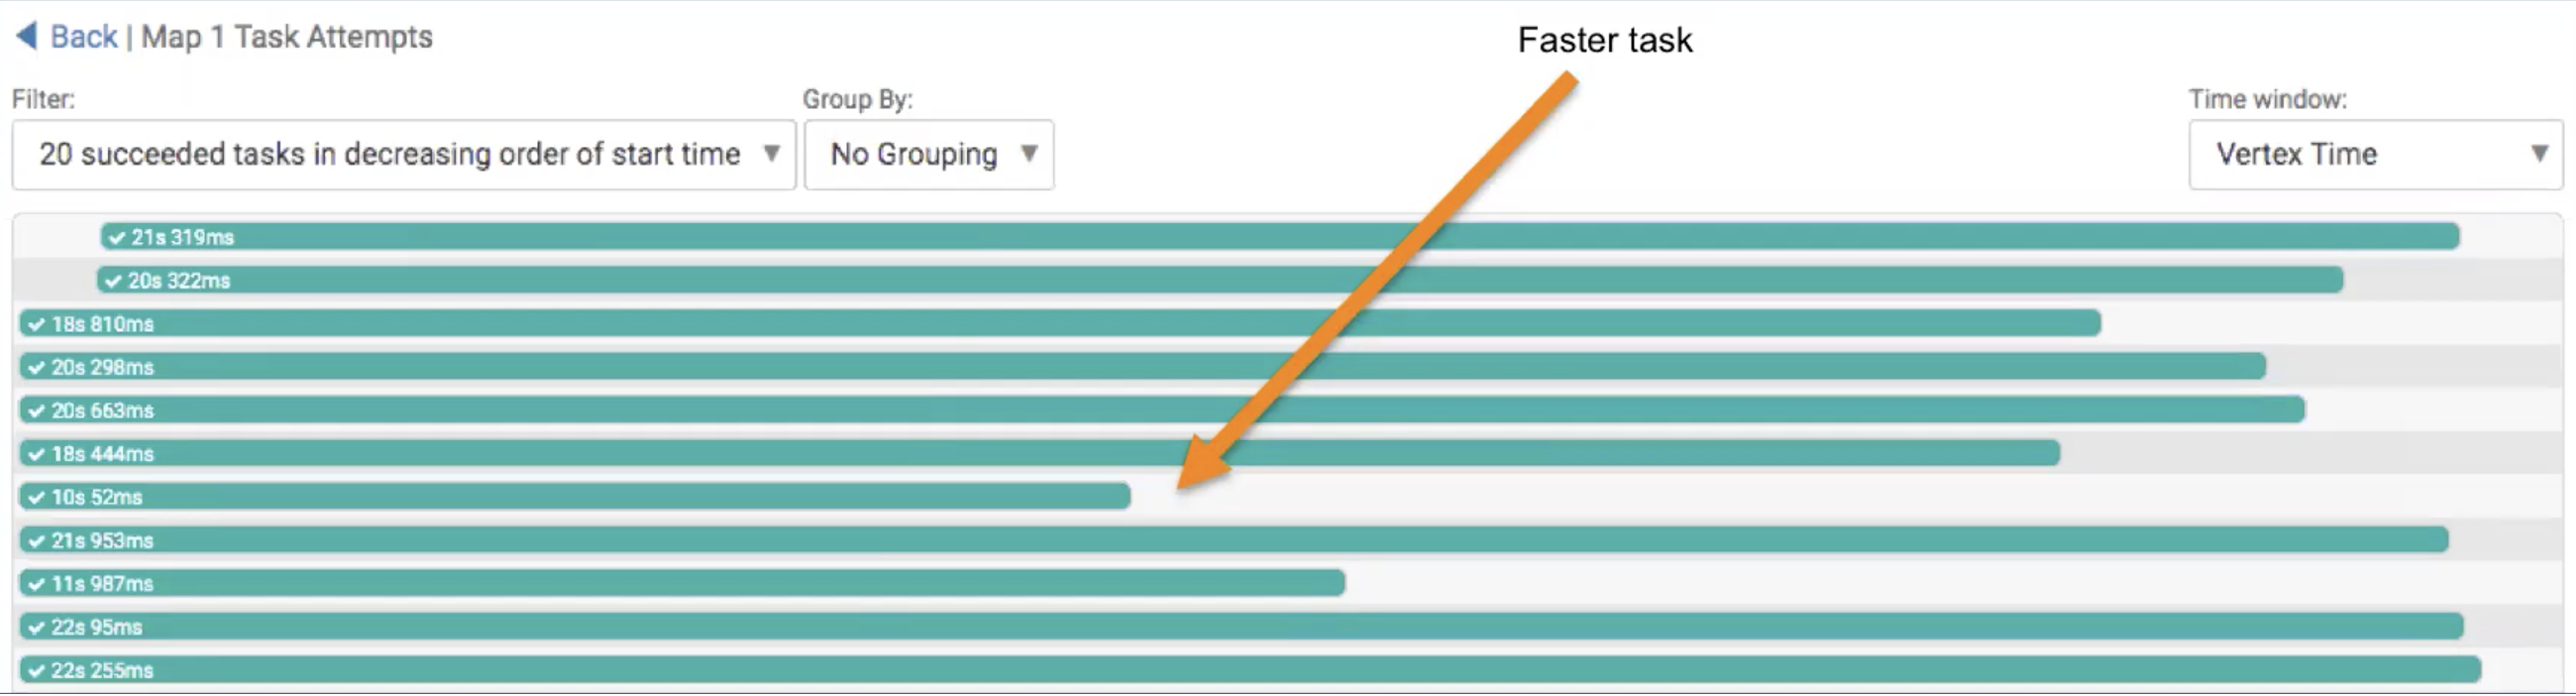
You can use this information to see what part of the query resulted in how many vertices and task attempts, such as the number of keys in the GROUP BY clause, or a JOIN condition.
To view the order in which the vertices are created, go to DAG FLOW. The DAG FLOW also shows which mapper or reducer is taking a long time or is not responding in case of long-running tasks or data skew.
To view the number of mapper and reducer counters for the job, the number of records accessed by the job, the number of tasks that were spun up, number of bytes read or written to HDFS or other storage platforms, and so on, go to the DAG COUNTERS tab. The numbers on the DAG COUNTERS may indicate any cartesian products or map side joins throwing OutOfMemory (OOM) errors, and so on.
To see the filtered view of Tez settings, go to the DAG CONFIGURATION tab.
Accessing detailed logs of mapper and reducer tasks
DAS also allows you to download detailed logs of a task attempt. The log provides information about the container in which the task was running. To download the logs, click anywhere on the task attempt. On the Details pop-up, click Open log in new tab.