Building a Chart with Time-Series Data
Use the Chart Builder to build a chart with time-series data.
- Select .
- Display time series in one of the following ways.
- Select a recently used statement: Click the
 to the right of the Build Chart
button to display a list of recently run statements and select a statement. The
statement text displays in the text box and the chart(s) that display that time series
will display.
to the right of the Build Chart
button to display a list of recently run statements and select a statement. The
statement text displays in the text box and the chart(s) that display that time series
will display. - Select from the list of Chart Examples:
- Click the question mark icon
 to the right of the
Build Chart button to display a list of examples with descriptions.
to the right of the
Build Chart button to display a list of examples with descriptions. - Click Try it to create a chart based on the statement text in the example.
- Click the question mark icon
- Type a new statement: Press Spacebar in the text box. tsquery statement components display in a drop-down list. These suggestions are part of type ahead, which helps build valid queries. Scroll to the desired component and click Enter. Continue choosing query components by pressing Spacebar and Enter until the tsquery statement is complete.
- Select a recently used statement: Click the
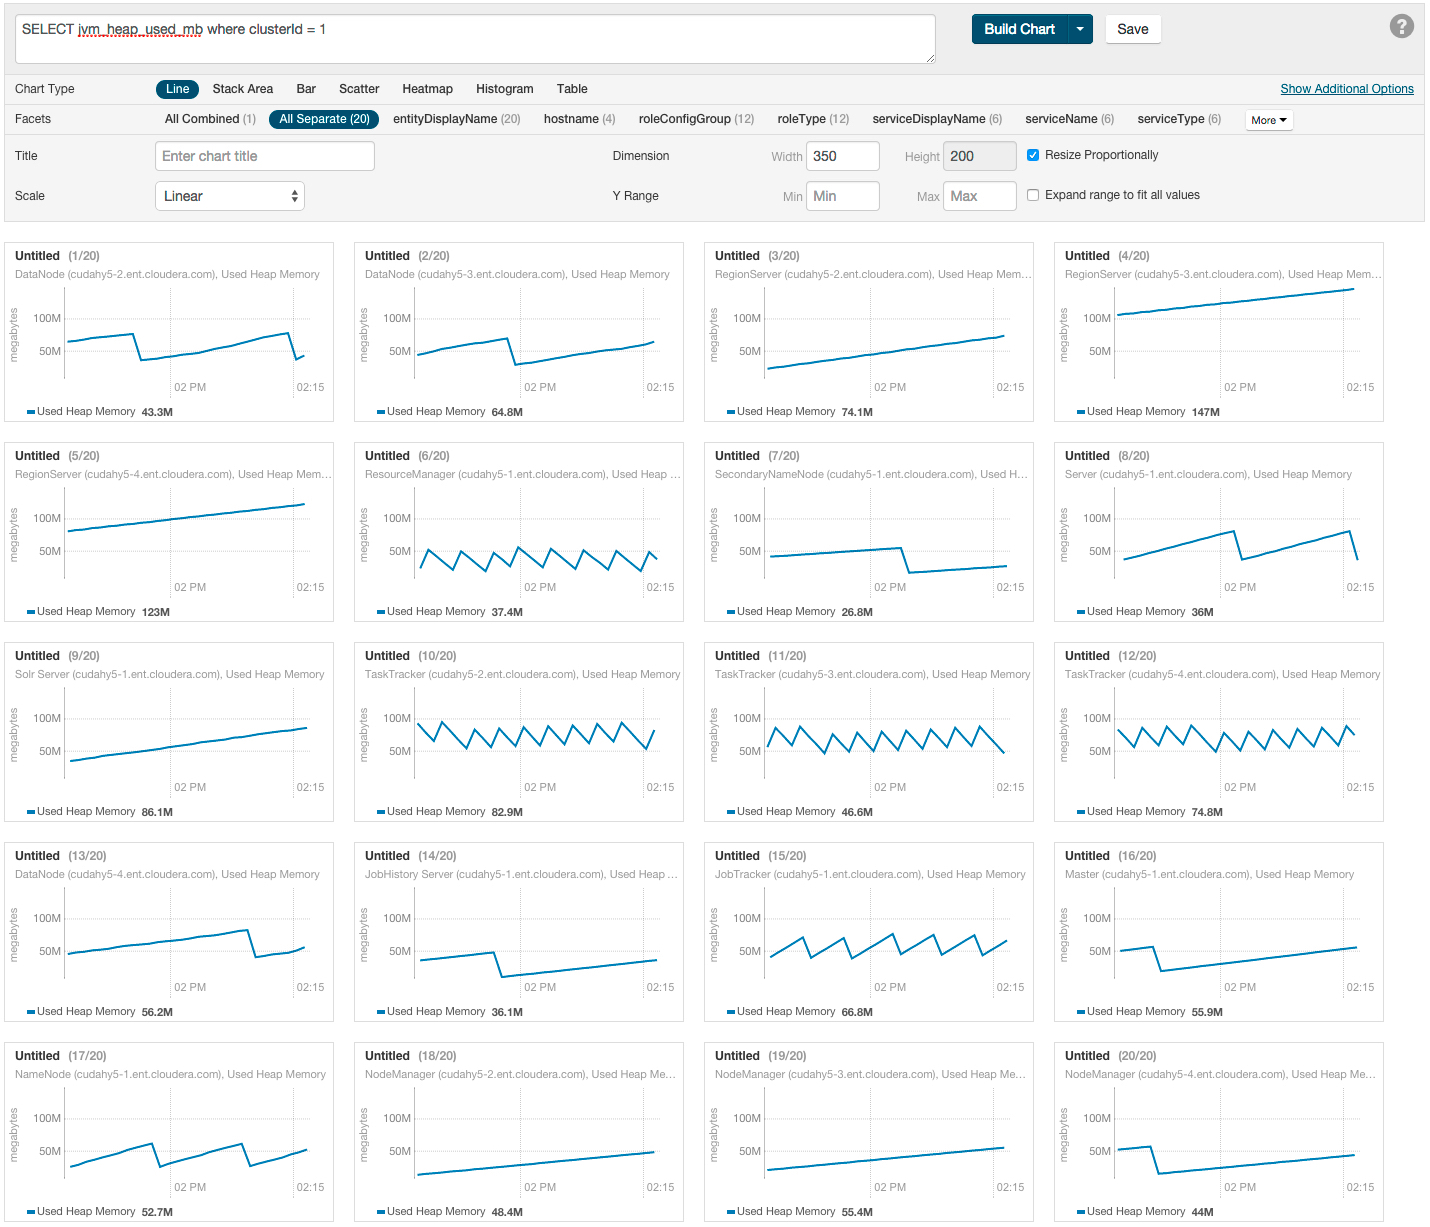
SELECT jvm_heap_used_mb where
        clusterId = 1
could return a set of charts like the
following: