End to end latency overview
You can use Streams Messaging Manager (SMM) UI to monitor end-to-end latency in Kafka topics. By monitoring latency, you get a complete understanding of the time taken by a consumer to consume a message that is produced in a topic. You can also monitor the number of consumed messages across all the consumer groups for a topic within the selected time range.
- Verify whether end-to-end processing time SLAs are met.
- Identify slow or lagging consumers.
- Verify whether messages are overconsumed or underconsumed.
- Messages Consumed. The graph provides you the overall produced message count and consumed
message count across all the consumer groups for a topic within the selected time range. Any
discrepancy in the produced and consumed message count is highlighted in red.
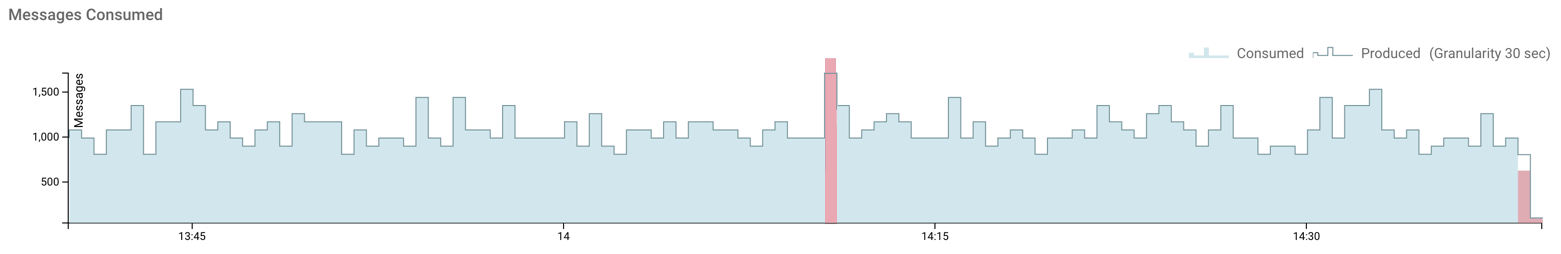
In the preceeding image, the linear formation represents the number of messages produced in last one hour, and the filled area represents the number of messages consumed in last one hour with a granularity of 30 seconds. The blue area signifies that all the produced messages are consumed. The red area represents a discrepancy in the produced and consumed message count and can either mean that messages are overconsumed or underconsumed.
In the image, there are two red areas. The first red area, from the left, indicates that the number of consumed messages is more than the number of produced messages. This represents an overconsumption of messages which can occur when a consumer group offset is reset to an older offset to reprocess messages, or when producers or consumers are shut down in an unclean manner.The last red area indicates that the number of consumed messages is less than the number of produced messages. This represents an underconsumption of messages which can occur when the consumer group offset is set to a newer offset causing the consumer group to skip processing some messages.
The far right section of the graph shows the current processing window where consumers are still consuming the produced messages. Therefore this area is expected to be marked red and indicates an undercsonumption of messages.
All other areas in the image are blue, which indicates that all the produced messages are consumed.
- End-to-end Latency. The End-to-end Latency graph provides you the details of the latency
range and average latency in consuming the messages, which are produced in a particular topic,
in milliseconds within the selected time range.
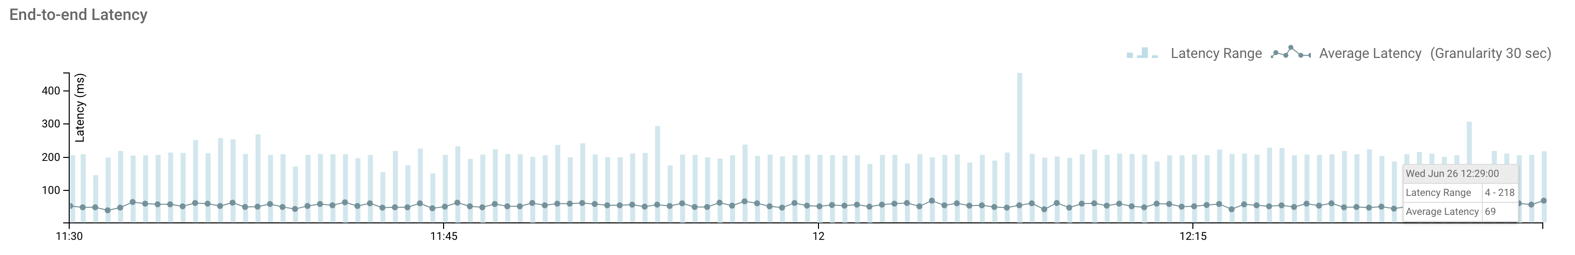
In the above image, the vertical lines represent the latency range, and the dotted line represents the average latency in consuming the produced messages in last one hour with a granularity of 30 seconds. You can see that at 12:29:00 hours on Wed Jun 26, the latency range was between 4 - 218 milliseconds and the average latency was 69 milliseconds.