Monitoring Kafka clusters
The overview page provides you with tools to see a snapshot of the Kafka cluster you are monitoring. After you select the Kafka cluster to monitor, you can see the total number of producers, brokers, topics, and consumer groups in that cluster. You can also monitor producer and consumer metrics.
Configure Apache Kafka for SMM
- Select Kafka from your cluster drop-down, and then select the Configuration tab.
- Ensure that the Enable Producer Metrics check box is selected.
Viewing cluster overview information
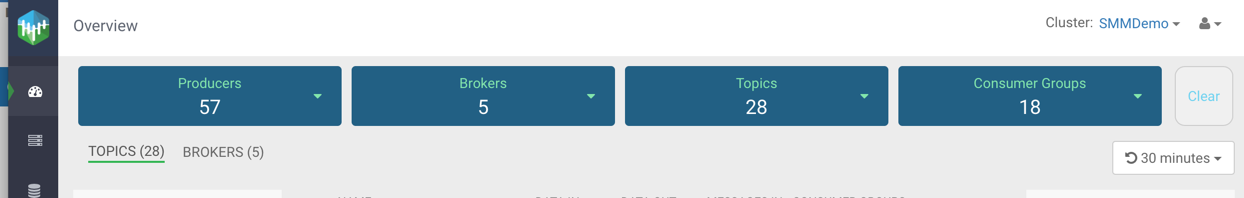
You can use the Overview tab to review information about your Kafka cluster. This page gives you information about total number of producers, brokers, topics, and consumer groups. It also provides more detailed metrics about producers and consumers.
Review the Producers, Brokers, Topics, and Consumer Groups information at the top of your page to understand how many of each are contained in your Kafka cluster.
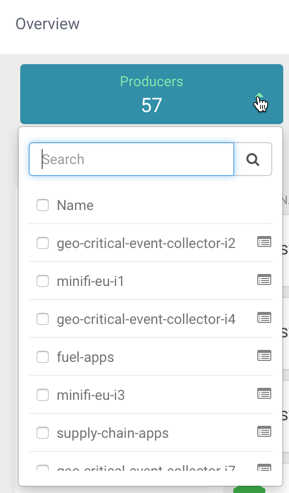
You can click the drop-down arrow in any of the boxes to view a list of Kafka resource. Select one or more Kafka resource to filter your view to just those resource. You can also search for a specific resource. You can click clear at any time to return to the full overview.