Prometheus metrics overview
Prometheus is a metrics store that pulls metrics from different endpoints which you configure. Prometheus is not the default metric store for Streams Messaging Manager (SMM). If you want to use Prometheus as the metric store for SMM, you need to download and configure it.
Prometheus supports a larger number of time series entities compared to the Cloudera Manager metric store.
If you use Prometheus, you can configure the roll up policy, delete specific time series entities, and configure scrape interval and metrics retention period.
- Kafka
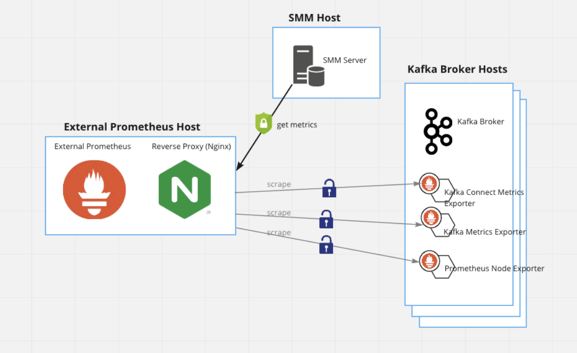
Kafka exposes a Prometheus metrics endpoint for Kafka metrics to be pulled.
- Kafka Connect
Kafka Connect, through configuration, exposes a Prometheus endpoint for Kafka connect metrics to be pulled.
- Prometheus Node Exporter
You need to configure a separate Node Exporter on each Kafka broker host and enable Prometheus to pull the system metrics.
SMM queries Prometheus for metrics over time. Prometheus fetches the metrics from the endpoints.
- TLS
- TLS with basic authentication
- mTLS