User impacts and limitations for Cloudera Manager in high availability mode
There are impacts and limitations you should be aware of when using Cloudera Manager in high-availablity mode.
Known Limitations
For a cluster running with Cloudera Manager High Availability in Active-Passive, it has some known limitations that you must be aware of.
- During the failover time (normally, a few seconds), any incoming API calls will be dropped because the load balancer will not redirect any API call to the Passive server during that period.
- Some commands that work with files (e.g. GenerateCMCA) may fail if a Cloudera Manager Server failover happens halfway. Those files will not be transferred during failover. You should retry such commands manually.
- You cannot enable Secure Credential Storage if Cloudera Manager high availability has been configured.
- The QueueManager service should be manually restarted if it indicates stale configuration after you restart the Cloudera Manger server after setting up High Availability.
- If the Active instance of Cloudera Manager server fails, and Cloudera Manager fails over to the Passive instance, Parcels must be downloaded again to the Passive instance. (Required only when adding new hosts, or services.)
- You can see some instances of following errors in server logs, which
can be safely ignored:
ERROR org.hibernate.engine.j1dbc.batch.internal.BatchingBatch - HHH000315:
Exception executing batch [org.hibernate.StaleStateException:
Batch update returned unexpected row count from update [0]; actual row count: 0; expected: 1; statement executed:
Cloudera Manager behavior
For a cluster running with Cloudera Manager High Availability in Active-Passive, it may behave differently from a non-HA Cluster in terms of success/failure/retry of operations.
- If the Active Cloudera Manager server fails while running commands or API calls:
- In general, “a server communication error warning” will pop up on the command processing UI. Once the Load Balancer redirects the traffic to the passive server, the warning will go away and the command will continue running.
- if the Active server is running while the Passive server fails
- If the Passive server node fails, the load balancer should be aware of this by monitoring the health check packets. As long as the Active node is running, users will not be affected.
- If both Active and Passive servers fail
- The Cloudera Manager Admin Console will no longer be accessible since there is no functional server running at this point.
- Time taken by failover from the Active to Passive server instance
- It depends on the health check settings of your load balancer. Take HAProxy as an example, by default, three consecutive failed checks are needed to remove the server from the load balancing rotation. The interval of each health check is normally 2 seconds. So it might take HaProxy 4-6 seconds to do the failover under a default setting.
- Time taken to fail back from the Passive server to the Active server
- It can take up to 25 seconds to fail back from the Passive server to the Active server. During this time the Cloudera Manager Admin Console returns a 404 error. This additional time is taken by the Cloudera Manager server to become operational.
Changes in Health Tests
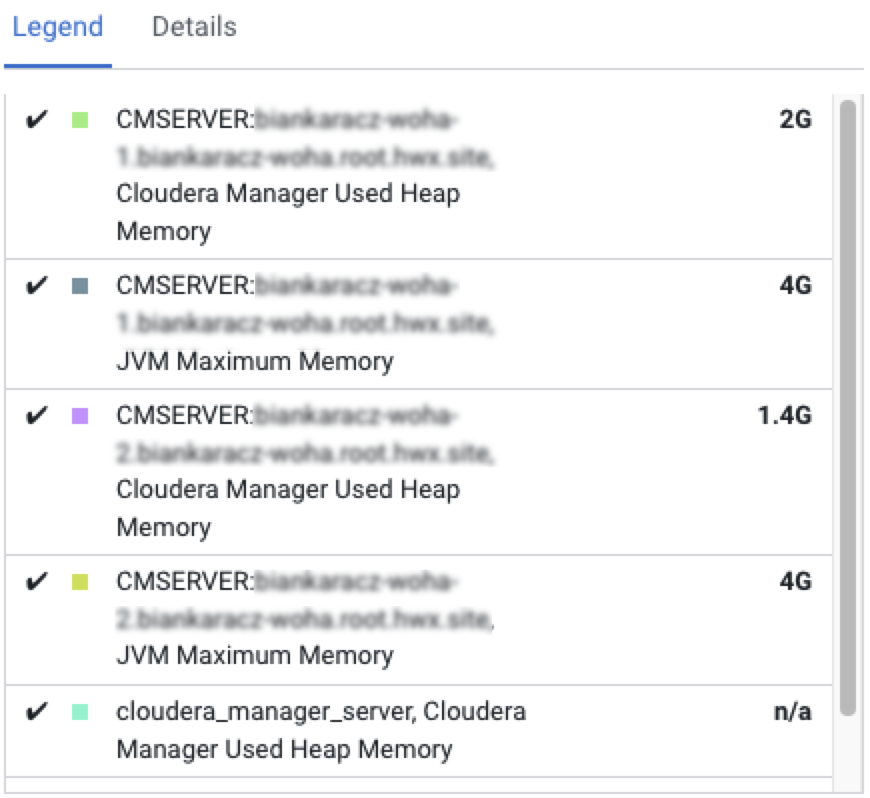
On HA-mode compatible versions, the naming of the Cloudera Manager server entities has changed to distinguish between multiple instances. This change will impact the customers that are upgrading from an earlier version.
In the earlier versions, the Cloudera Manager server name was
cloudera_manager_server, which changed to
CMSERVER:{Cloudera Manager server's host
            name}.
Due to this name convention change, you
will observe in the chart below that the Cloudera Manager server has a
new name and color on the charts. Meanwhile, the metrics for the old
entity name are still available.
The cyan area in the chart represents the single Cloudera Manager server running in non-HA mode. The green and purple areas represent the 2 Cloudera Manager servers with HA enabled.
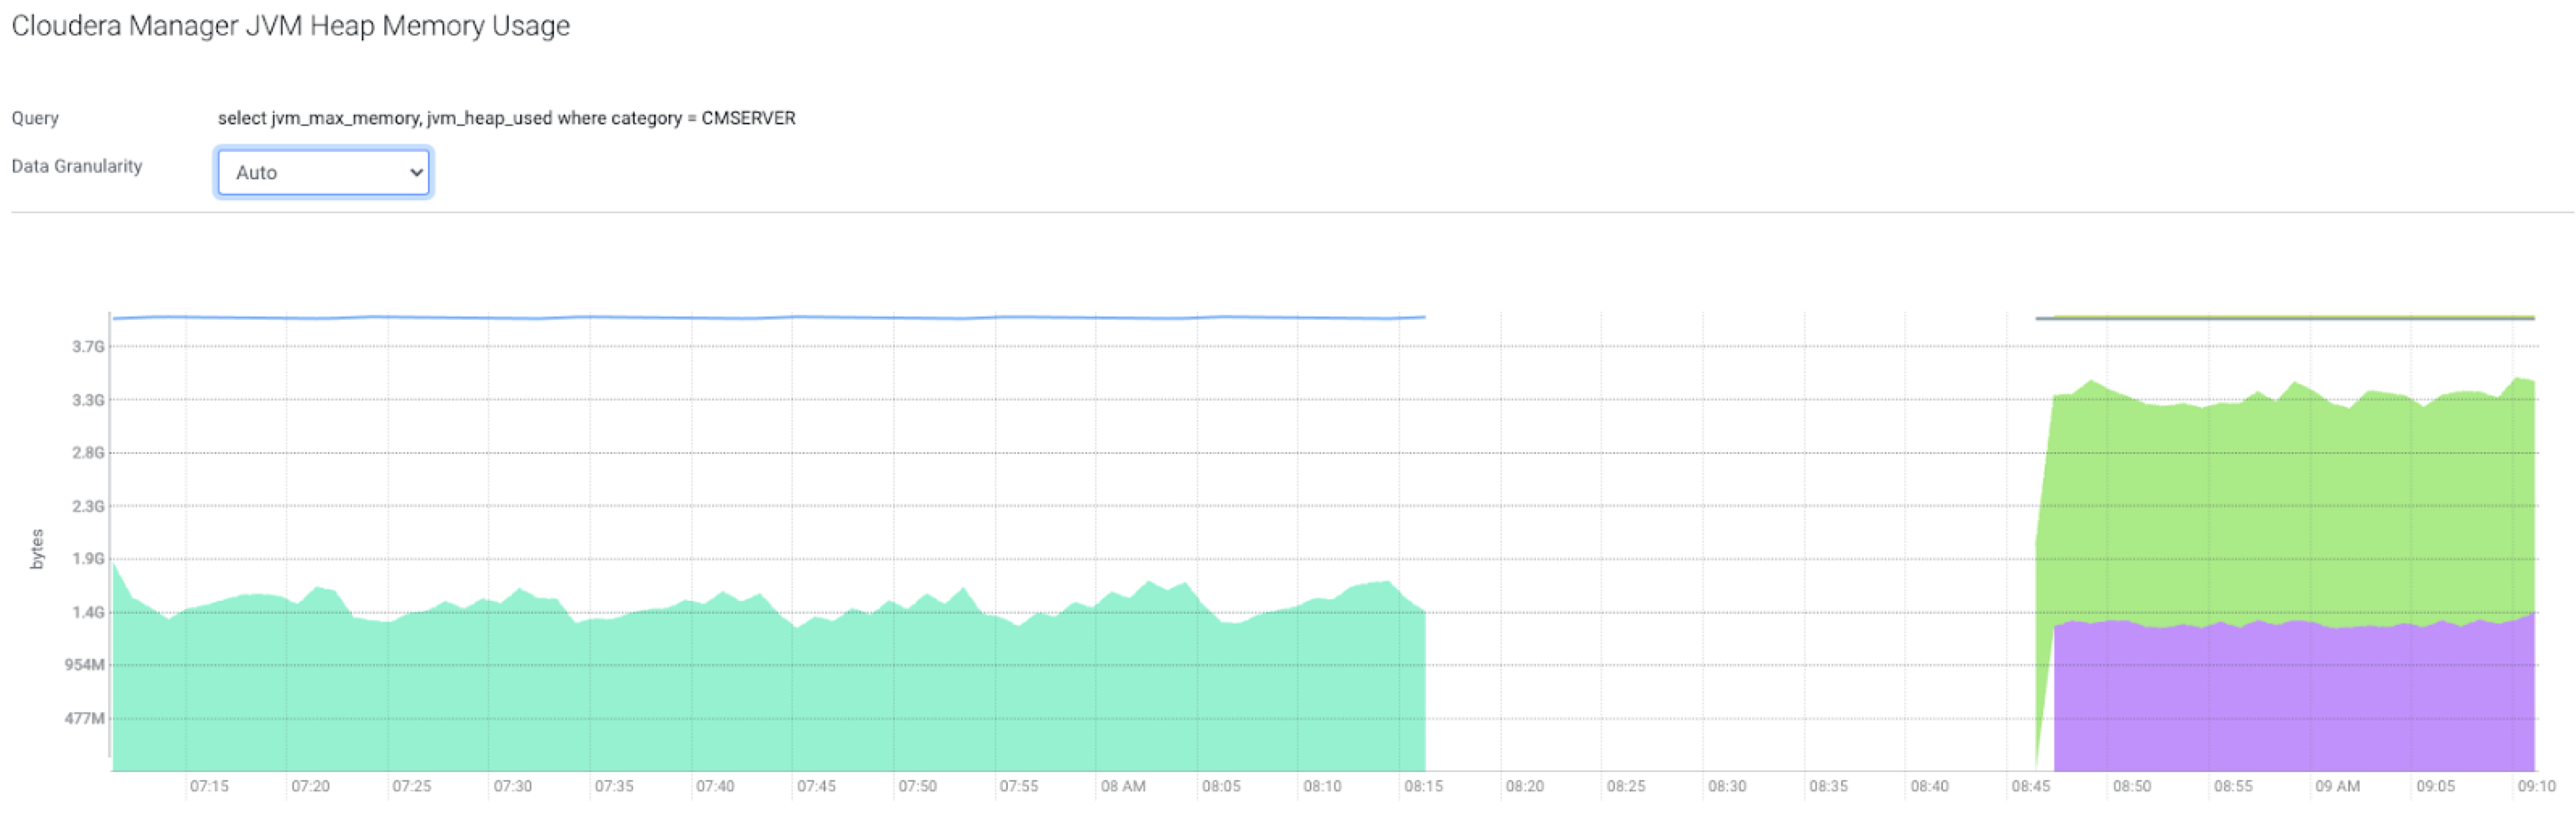
The metrics are still available with the old entity name (cloudera_manager_server) after an upgrade to an HA-compatible version.
SELECT cm_database_size WHERE entityName = "cloudera_manager_server" AND category = CMSERVERselect cm_database_size where category = CMSERVER