By monitoring Kafka topics, you can track the total number of topics in your cluster and
details about the topics. You can also monitor Grafana metrics for the topics in your
cluster.
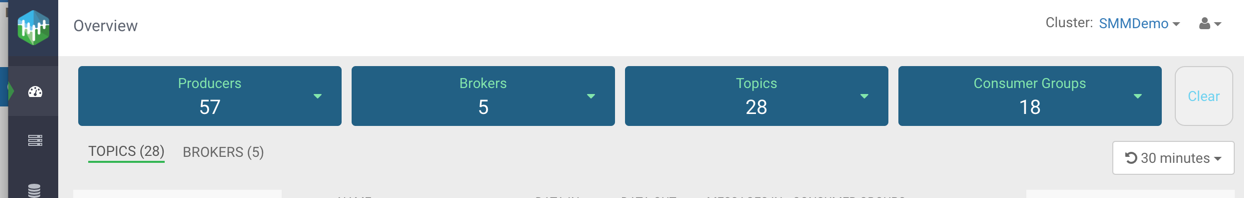
Viewing the total number of topics in your cluster
You can see the total number of topics in your Kafka cluster on the
Overview page.
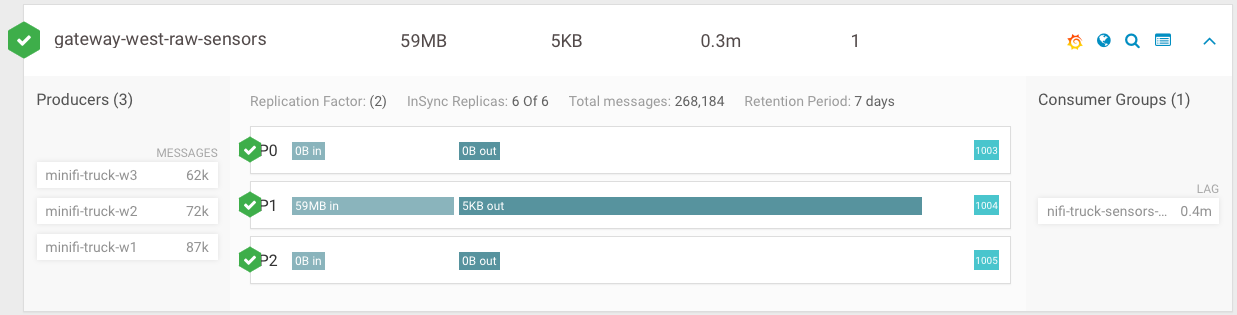
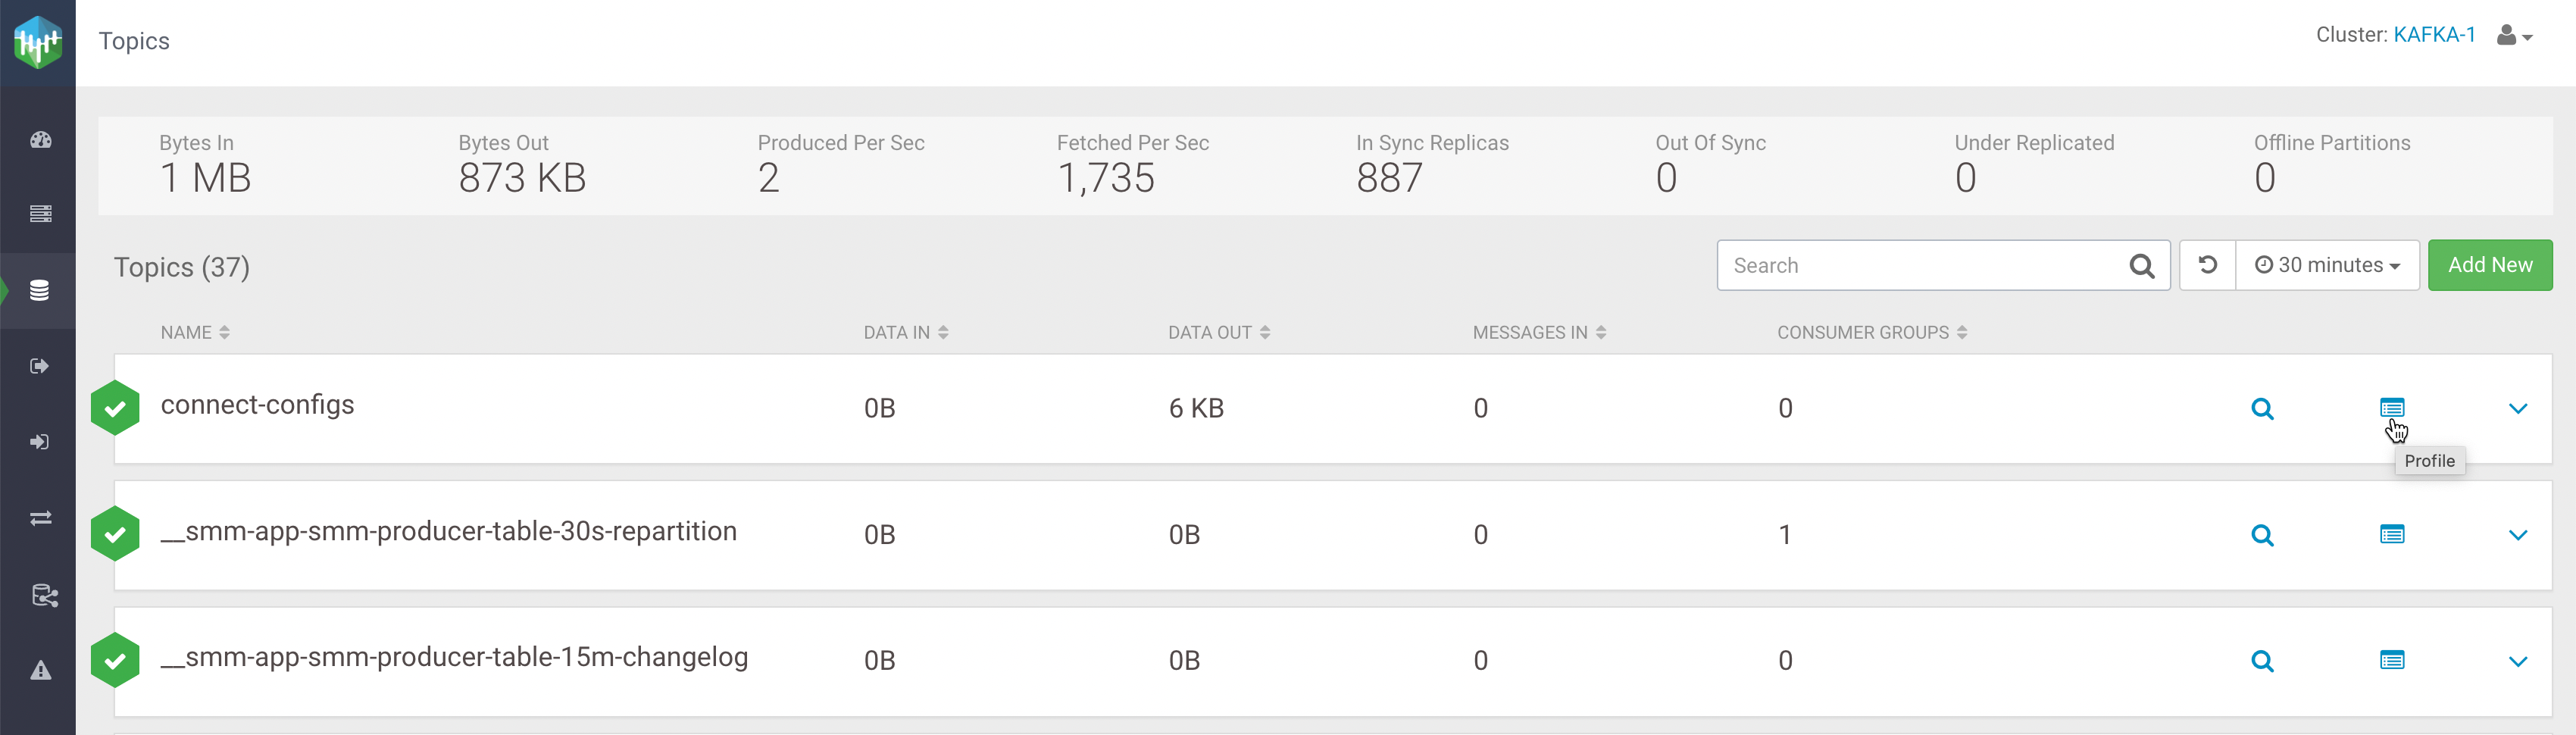
Detailed information about topics
The Topics page contains a number of useful details about your Kafka
topics. This page helps you answer the following questions:
How can I see if the replicas in this topic are in sync?
How do I see this topic's retention rate?
How can I see the replication factor for this topic?
How do I see the producers and consumers that are connected to this topic?
How do I find the total number of messages going into this topic, over a specified time
range?
To access this detailed topic information:
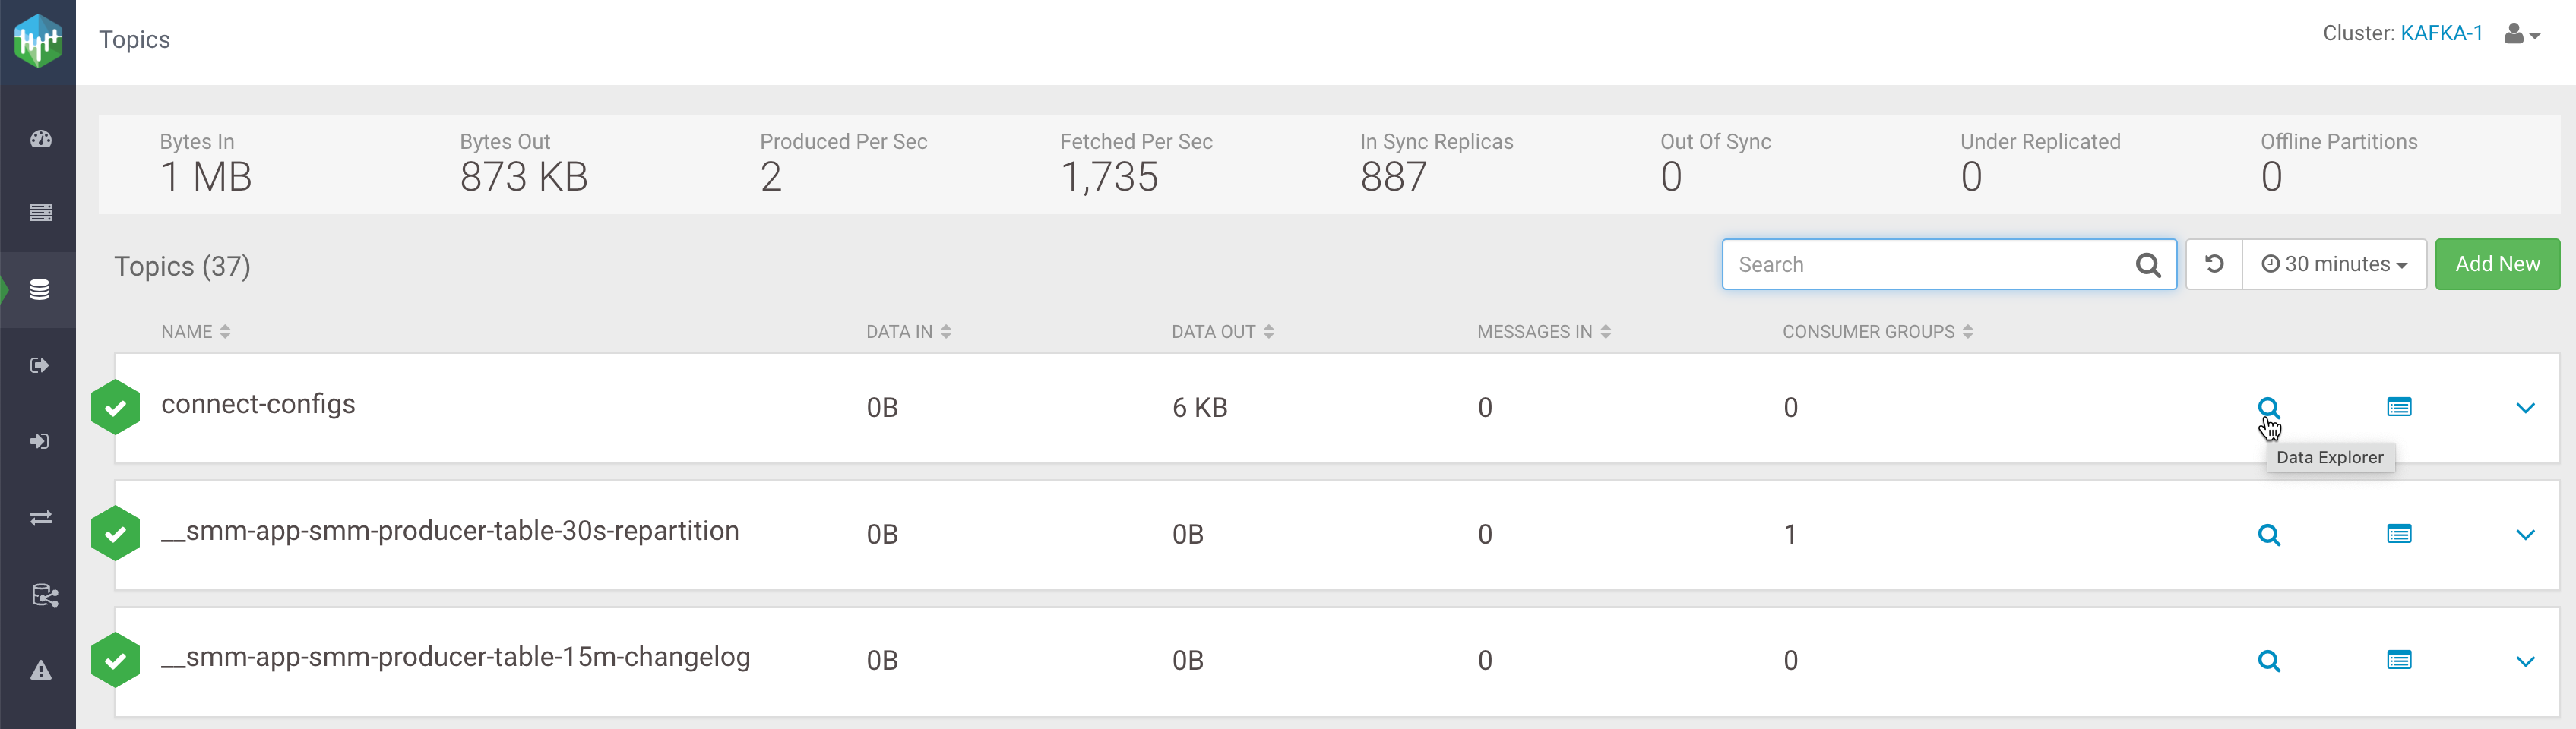
From the left navigation pane, click Topics.
Identify the topic about which you want information. You can either scroll through the list
of topics, or use the Search bar at the top left of the page.
Click the green hexagon at the left of the topic to view details.
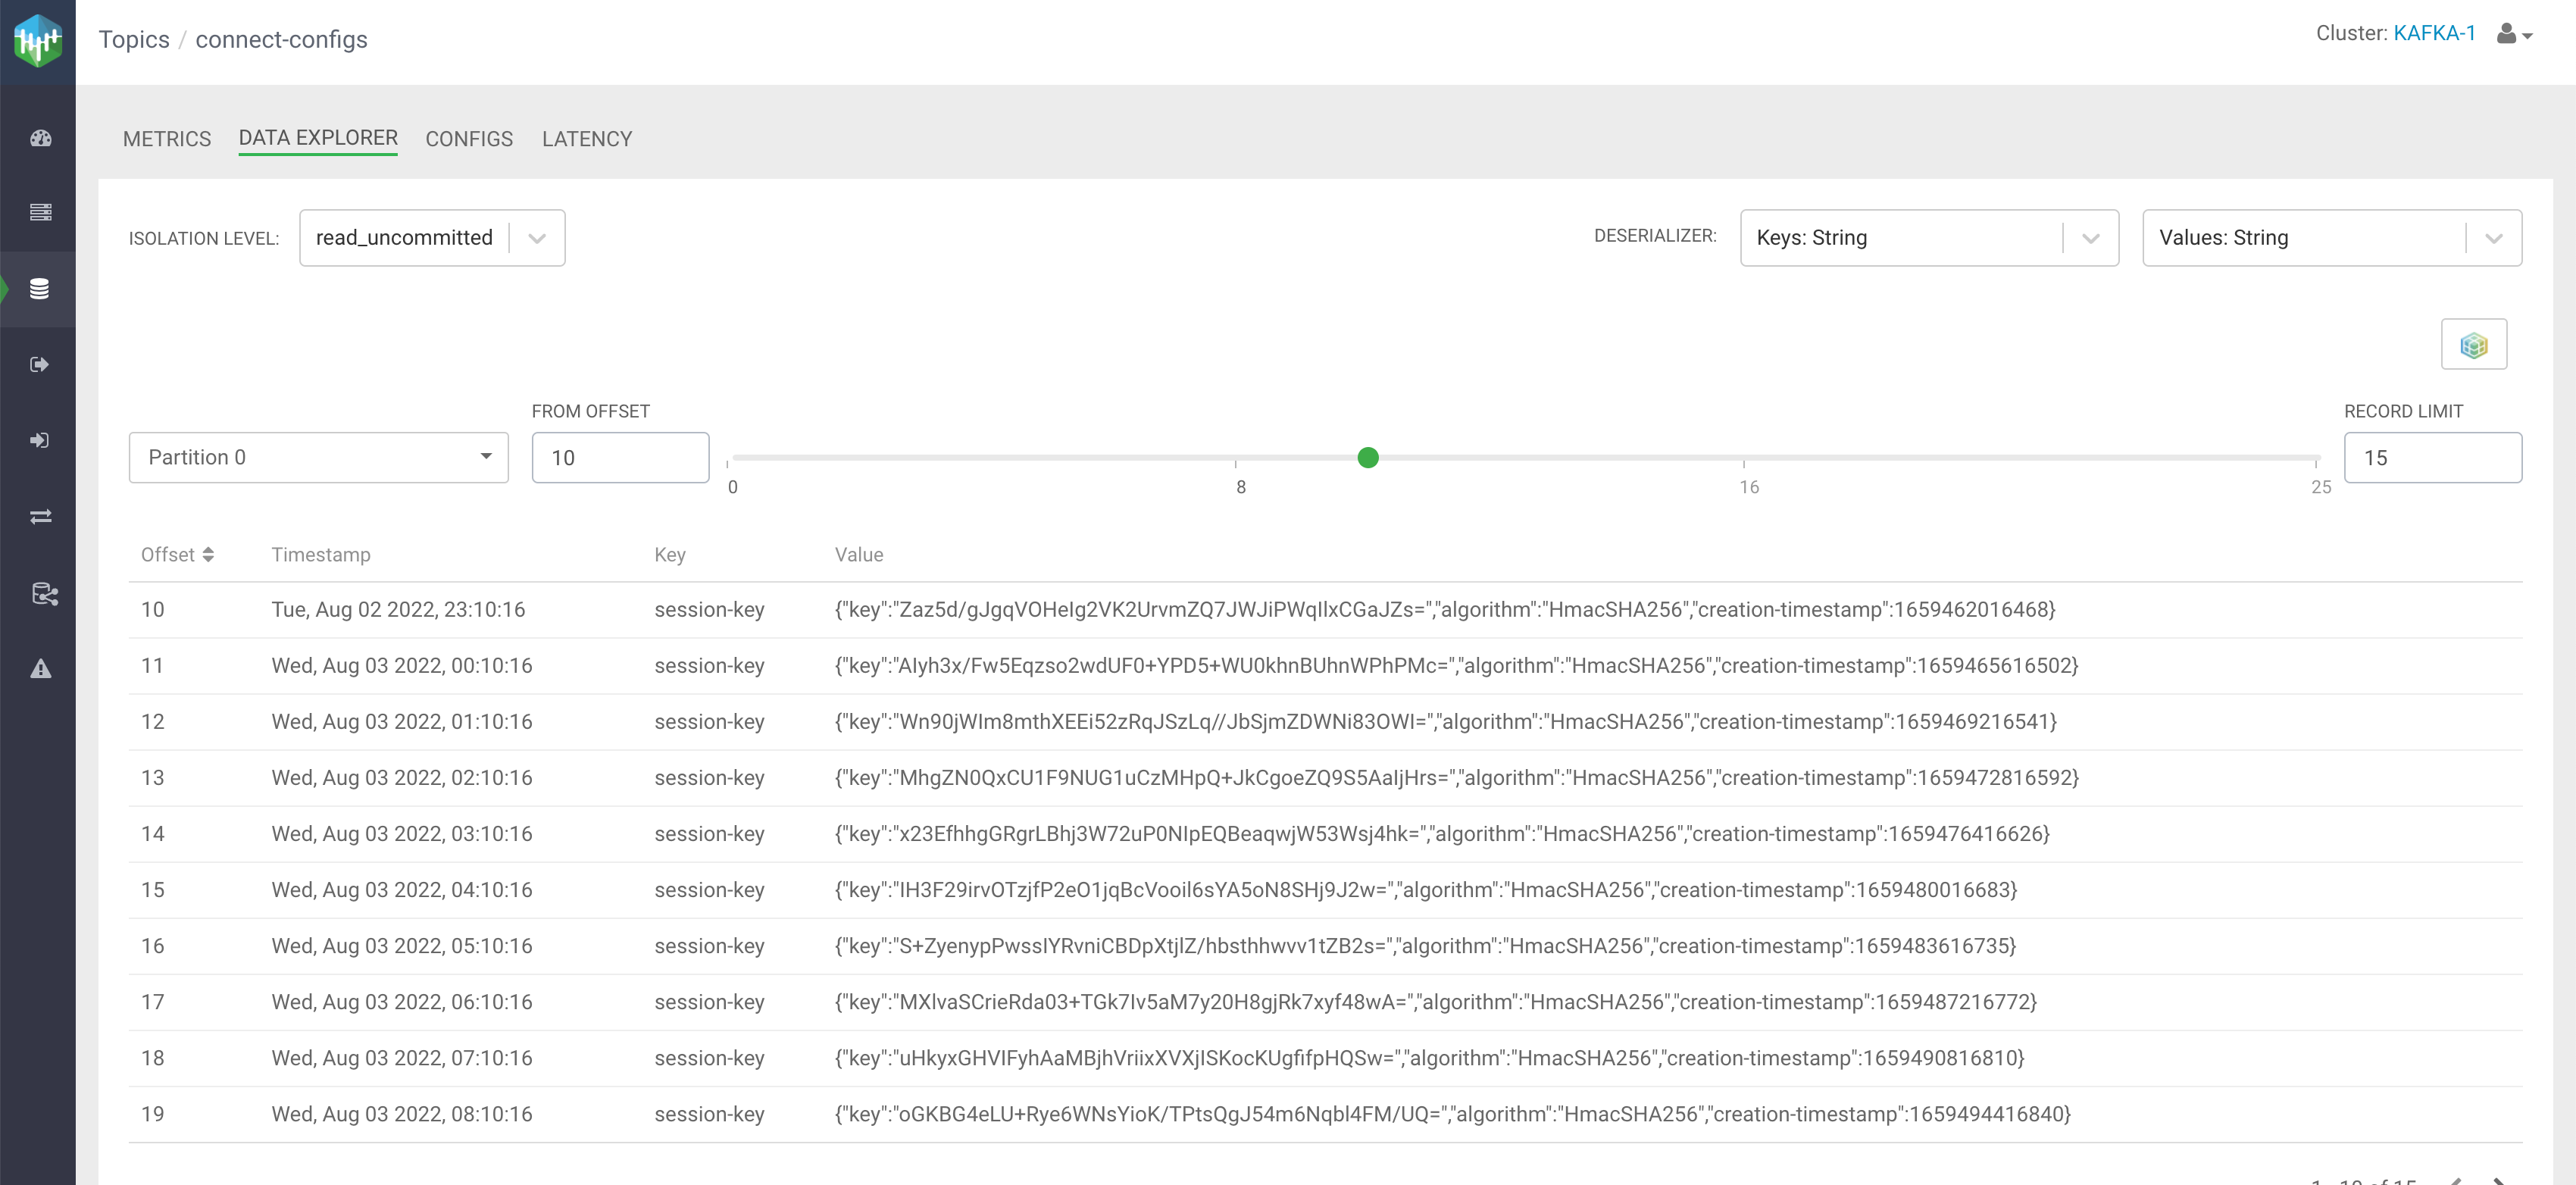
Viewing topic messages using Data Explorer
Data Explorer is a simple Kafka consumer within SMM. It enables you to view the content of a
Kafka topic. You can select any Kafka topic and any partition within that topic, and view
messages from the selected partition.
You can reach Data Explorer in two ways. One way is from the Topics
page, and the other is from the Overview page. In both pages, you need
to either click the magnifier icon, or navigate to the Topic Details
page and then select the Data Explorer tab. The following steps
describe the process:
Log in to the SMM UI.
From the left navigation pane, click Topics.
Identify the topic for which you want the message information. You can either scroll
through the list of topics, or use the Search bar to find a
topic.
Click the Data Explorer icon for that topic.
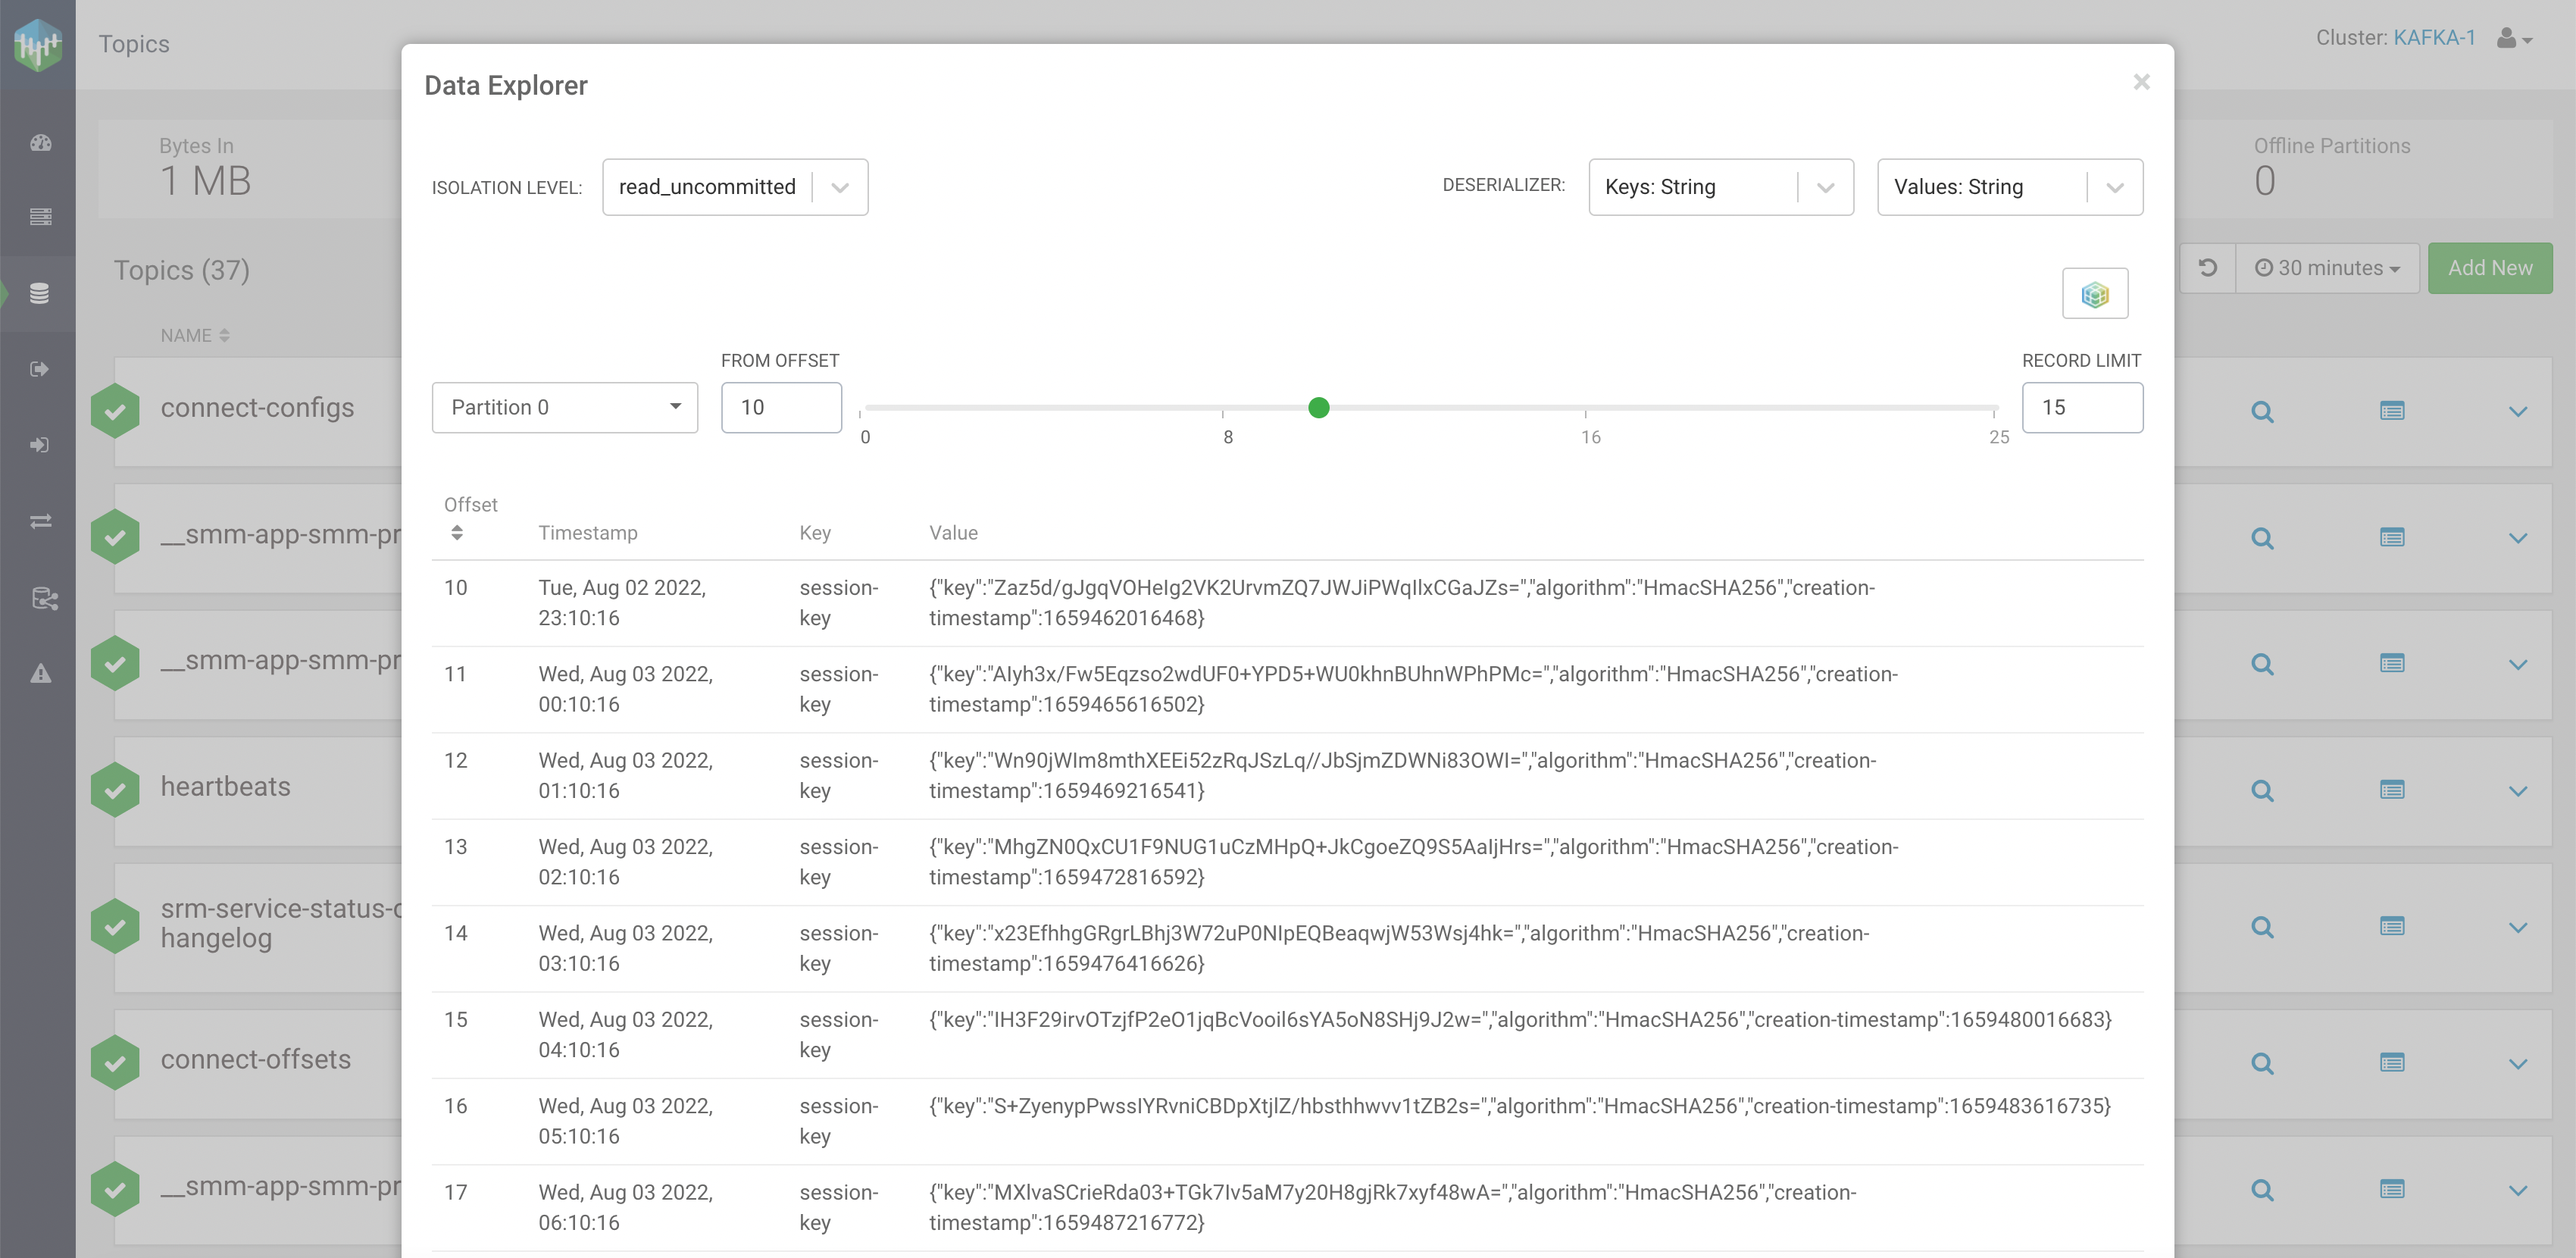
The Data Explorer dialog appears.
Alternatively, you can click the Profile icon for
that topic. Then go to the Data Explorer tab.
Select any of the following modes in the Isolation Level
option:
read_committed
read_uncommitted
The isolation level specifies whether uncommitted transactional messages should
be read. By default, it is set to read_uncommitted.
Select the deserializer types for the Keys and
Values options.
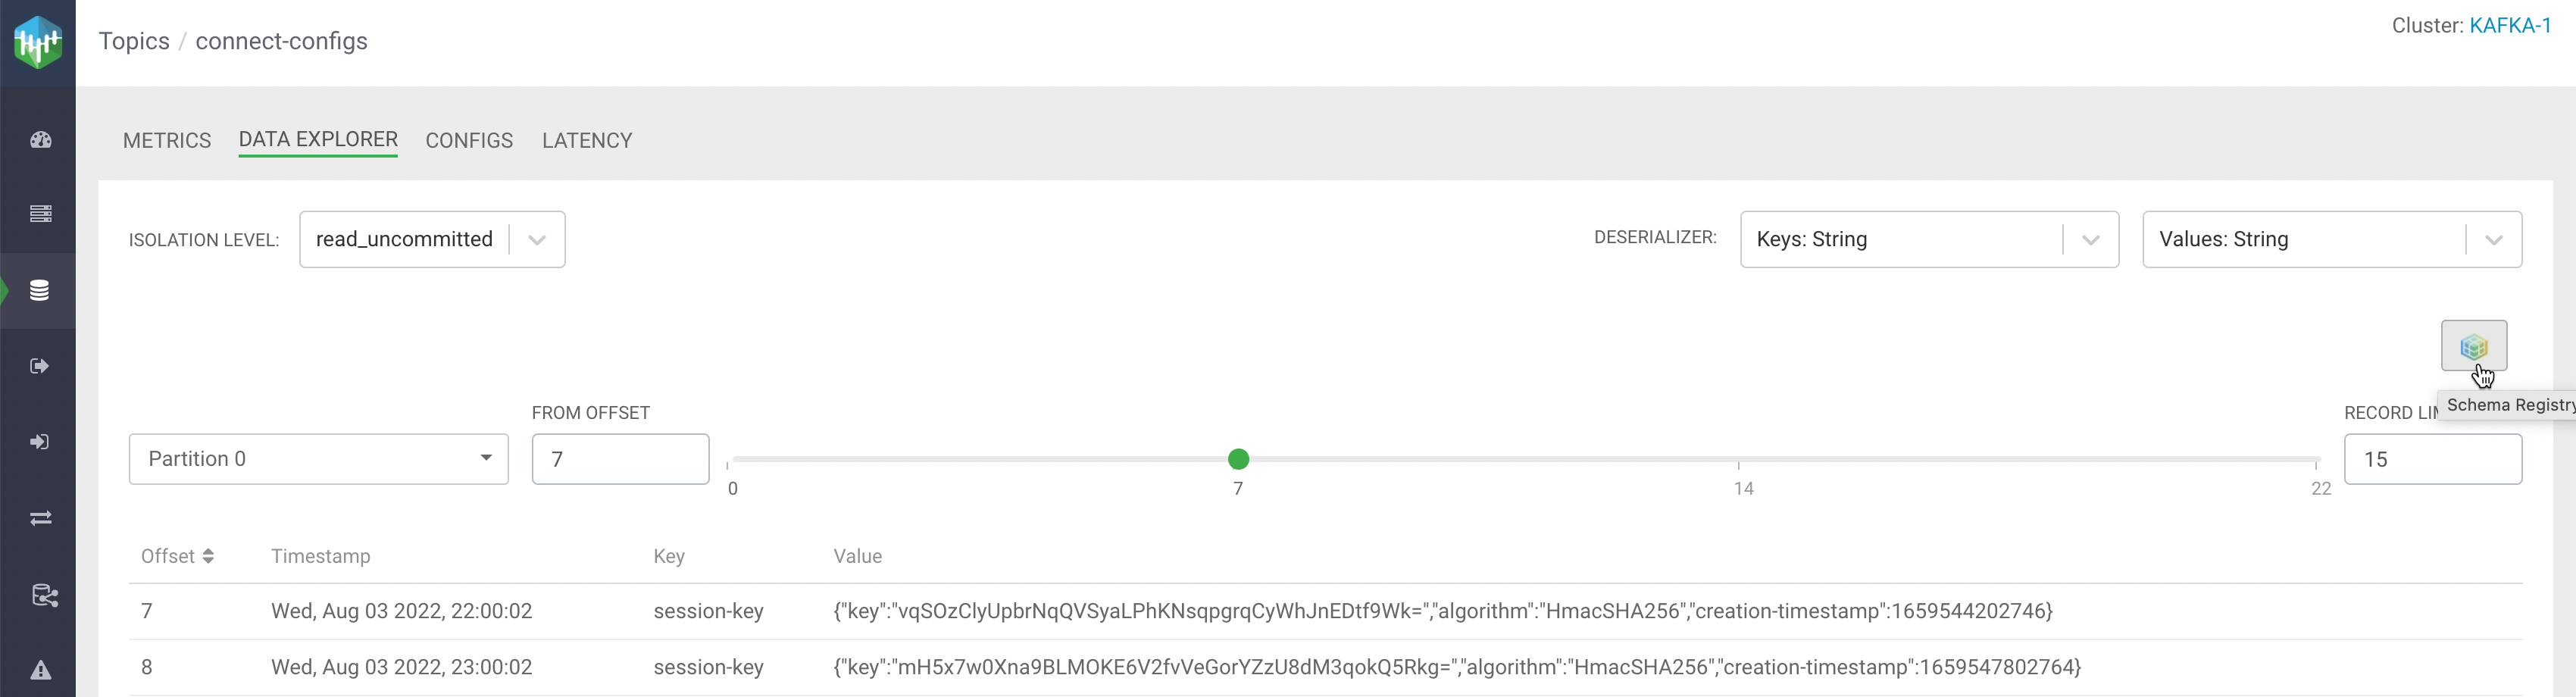
For example, if you select Avro, SMM uses the
schema that can be found in Schema Registry to deserialize the messages.
Select a Partition.
The Kafka topic must have partitions to
select from.
Select a value for the From Offset field.
You can also use
the selection bar to select an offset value. The maximum value is the offset of the
last message.
Select a Record Limit.
The record limit value is the number
of messages that are fetched starting from the message offset number selected in the
From Offset field.
To see long messages, click show more beside a message.
The
message opens in a dialog or a new tab based on the size of the message.
Click the Schema Registry icon to go to
the related page in the Schema Registry UI.