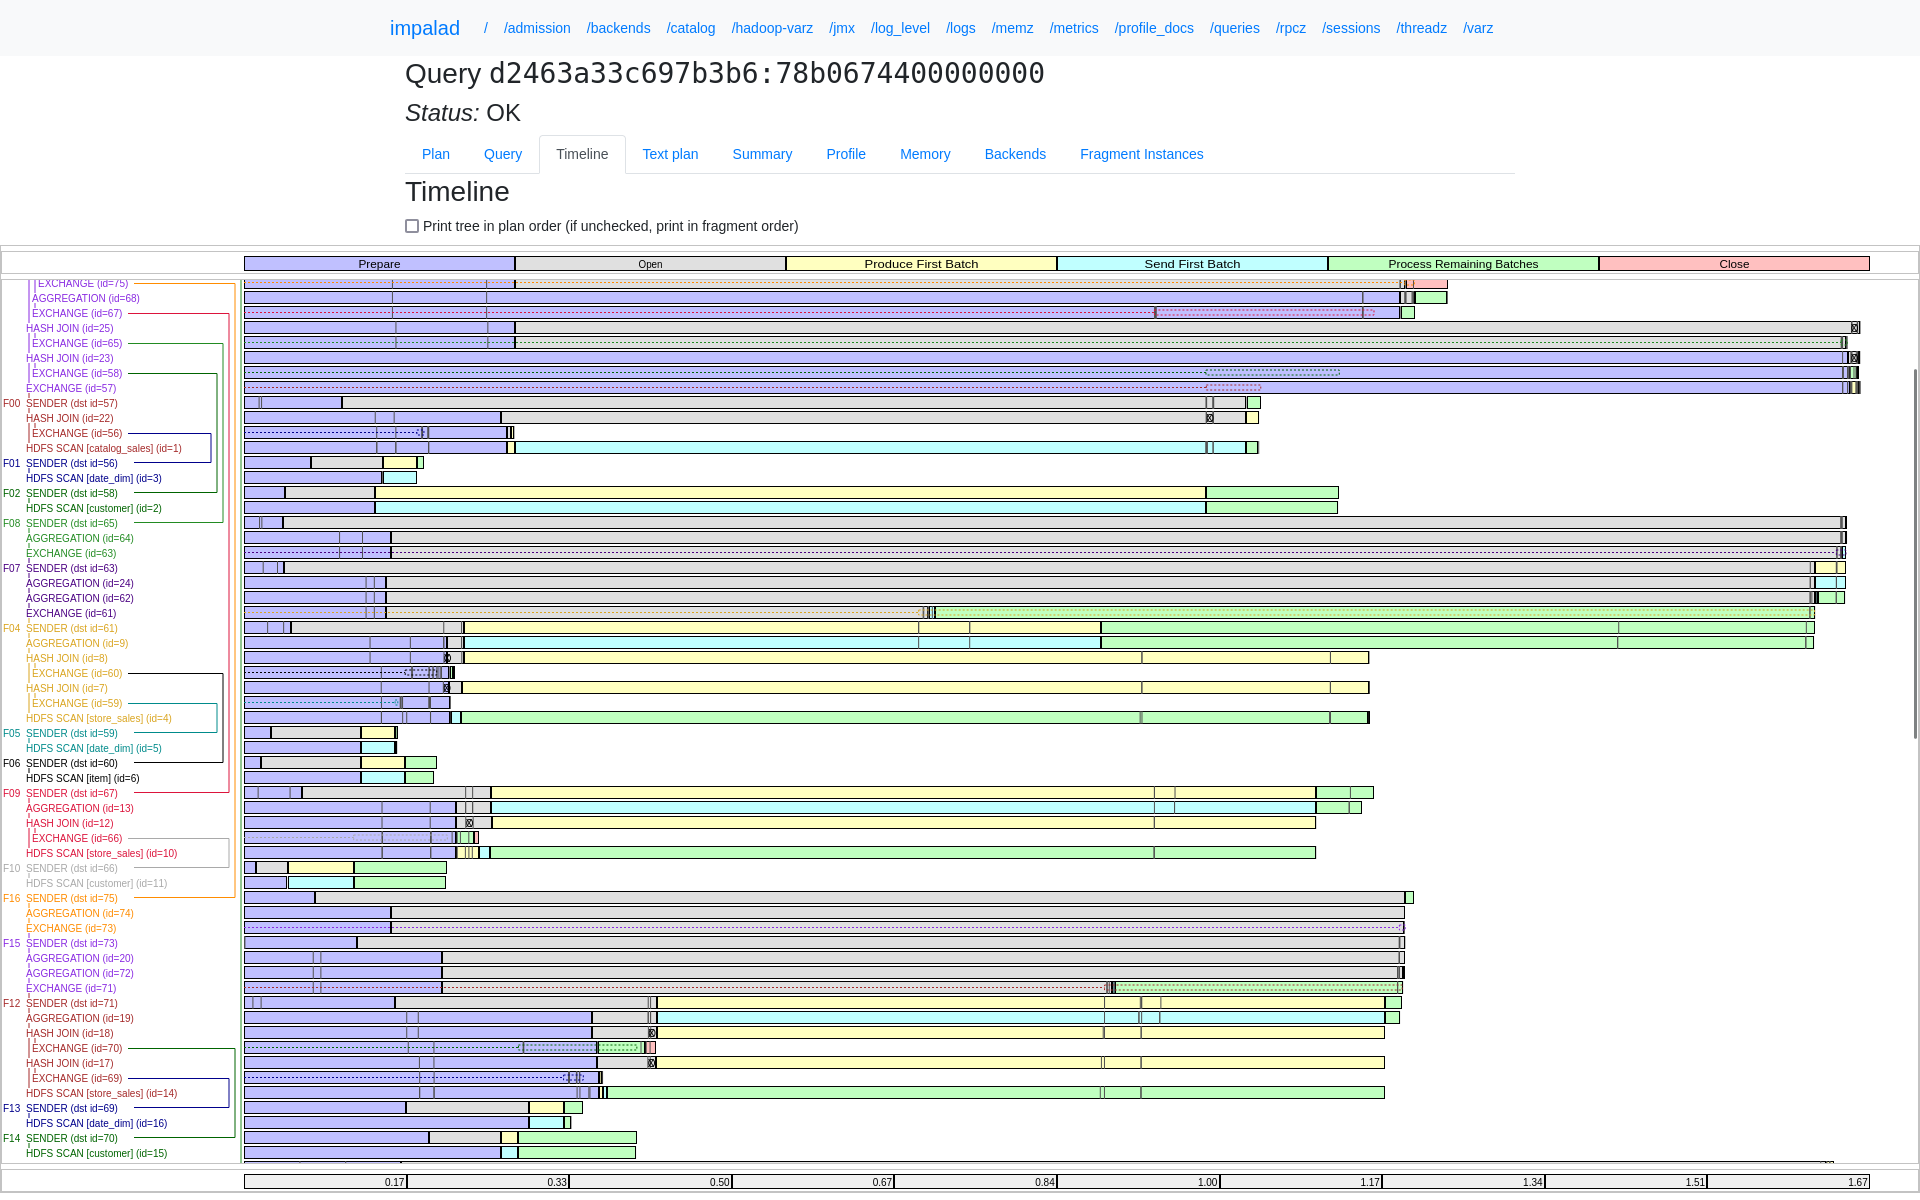
Debug Web UI for Query Timeline
For a detailed report on how a query was executed and to understand the detailed performance characteristics of a query, you can use the built-in web server’s UI and look at the Gantt chart.
The Gantt chart is an alternative to the profile command and is a graphical display in the WebUI that renders timing information and dependencies. This chart allows you to determine where queries are spending time instead of looking for timing information in the profile. Once you identify which fragments or operators are consuming the most time you may need to look at the summary profile or full profile to drill down further.
In subsequent releases, the timeline will be enhanced to display additional details so that looking at the profiles will not be necessary.
Here is the screenshot of the Gantt chart that shows the Query timeline of a TPC_DS query.

