Configuring audit spool alert notifications
You can enable and configure alerts for Ranger plugin supported services on Cloudera Manager that notify when audit spool files are accumulated.
- For Solr
- xasecure.audit.destination.solr.batch.filespool.dir = /var/log/<service_name>/audit/solr/spool
- For HDFS
- xasecure.audit.destination.hdfs.batch.filespool.dir = /var/log/<service_name>/audit/hdfs/spool
If the Solr server goes down for a long period of time or, if a large number of audit events occur while the Solr server is down; then spool files accumulate in the spool directory. Spool file accumulation consumes system memory. Sometimes, audit records in spool files become corrupted, and may not be restored when the Solr server returns to a running state. Corrupted, un-restored records also cause spool file accumulation. This requires manual cleanup of corrupted spool files. An unnoticed large accumulation or "piling up" of spool files may fill the local filesystem and result in service failure.
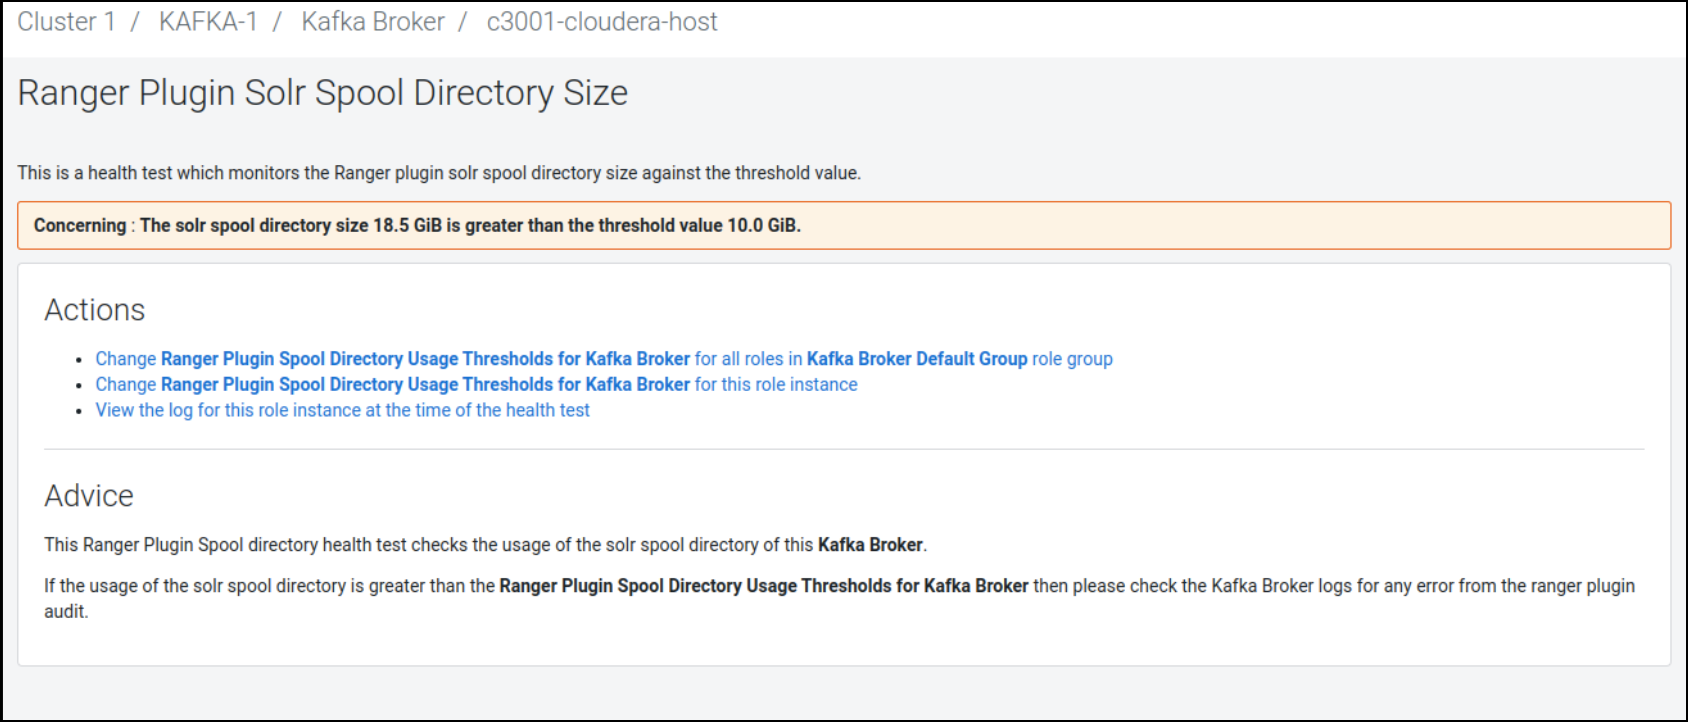
After you enable spool directory metric usage for a service, an alert appears on the Cloudera Manager UI which notifies the user when spool files have piled up in the spool directory. The Cloudera Manager agent measures the disk usage of the spool directory and registers it as a metric value. This metric value is compared against a threshold value. The spool alert appears on the Cloudera Manager UI if the metric value is greater than the threshold value.
- Solr
- ranger_plugin_solr_spool_directory_size
- HDFS
- ranger_plugin_hdfs_spool_directory_size
The following table lists Ranger plugin supported service names and roles that support spool alerts.
| Services | Roles |
|---|---|
| HDFS | NAMENODE |
| HIVE | HIVEMETASTORE |
| HIVE_ON_TEZ | HIVESERVER2 |
| HBASE | MASTER, REGIONSERVER |
| YARN | RESOURCEMANAGER |
| IMPALA | IMPALAD, CATALOGSERVER |
| ATLAS | ATLAS_SERVER |
| KAFKA | KAFKA_BROKER |
| KNOX | KNOX_GATEWAY |
| KUDU | KUDU_MASTER |
| RANGER_KMS | RANGER_KMS_SERVER |
| RANGER_KMS_KTS | RANGER_KMS_SERVER_KTS |
| RANGER_RAZ | RANGER_RAZ_SERVER |
| SCHEMAREGISTRY | SCHEMA_REGISTRY_SERVER |
| STREAMS_MESSAGING_MANAGER | STREAMS_MESSAGING_MANAGER_SERVER |
To enable or disable spool directory alerts:
-
In Search, type spool
directory.
The following configuration properties display (this example uses the Kafka Broker role from Kafka service)
Figure 1. Audit Spool Alert Configurations for Kafka Broker 
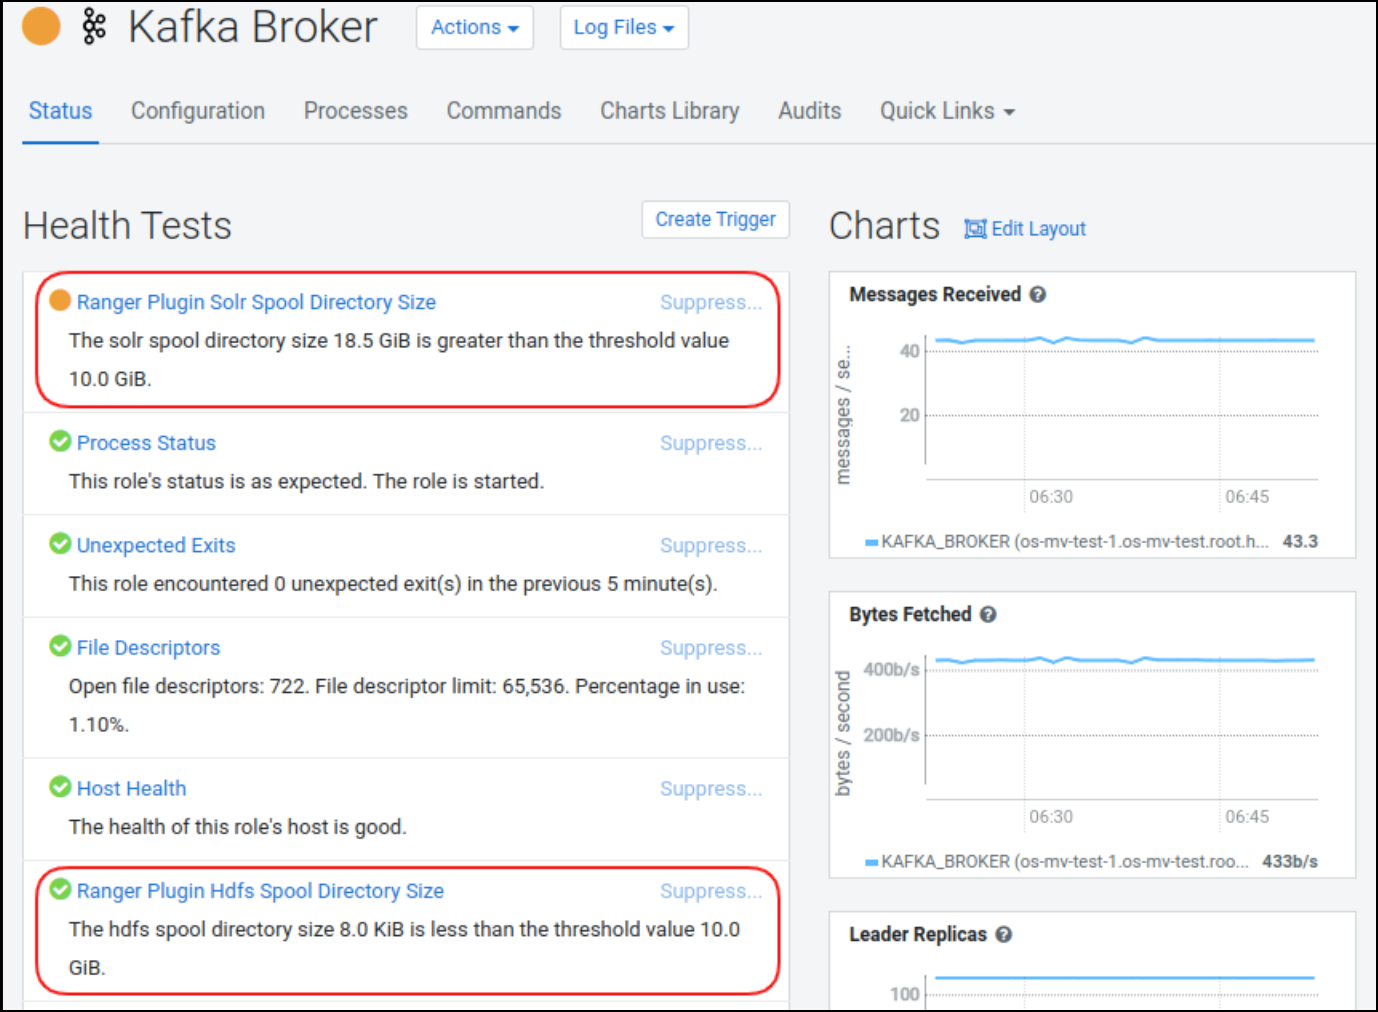
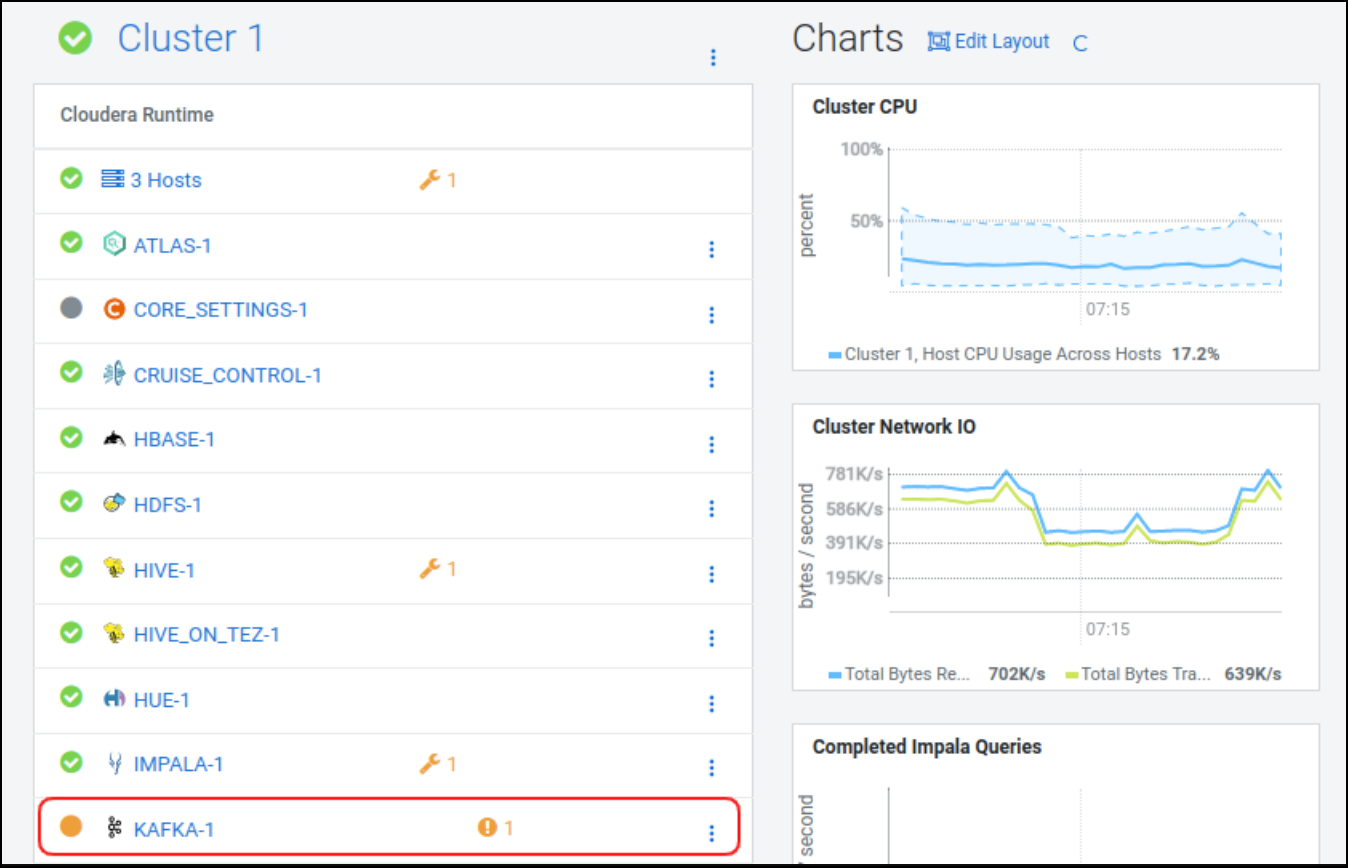
These spool alert details appear on the Ranger plugin service Role status page in the Cloudera Manager UI, as shown for Kafka Broker role in the following example: