OpenTelemetry support for Hive
Learn how Hive uses OpenTelemetry (OTel) to collect and publish telemetry data, processed by a user-configured OTel collector for visualization in systems like Jaeger and Prometheus.
Overview
As part of this offering, Hive in Cloudera Runtime7.3.1.500 SP3 includes an OTel exporter that helps to collect, filter, and publish telemetry information, such as infrastructure and workload metrics, live and historical query data.
HiveServer2 and LLAP integration with OTel
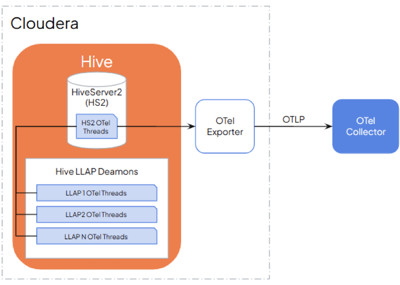
OTel threads function independently in both HiveServer2 and LLAP daemons. When query execution begins, these threads capture essential telemetry data, which is transmitted to an OTel collector based on a configurable recurring schedule. The collected data is then processed and forwarded to backend systems for visualization.
HiveServer2 integrates with the OTel agent to expose both query-related data and JVM metrics. A dedicated thread or service runs within HiveServer2 to handle this integration. This thread collects query details and metrics, which are then transmitted through the OTel agent. These transmitted metrics can be collected by OTel collectors for analysis and visualization.
Metrics specific to each LLAP daemon, such as JVM and memory-related statistics, are also transmitted for detailed observability.