Learn how to configure Prometheus to collect Kudu metrics by updating the Prometheus configuration file.
Before configuring Prometheus and Grafana, ensure that you have the following components available:
- A running Kudu cluster with at least one Master node and one Tablet Server node.
- An installed Prometheus instance.
- An installed Grafana instance.
-
Open the prometheus.yml configuration file in a text editor.
-
Add the Kudu scrape job to the
scrape_configs section.
The following example shows a static target configuration:
global:
  scrape_interval: 15s
  evaluation_interval: 15s

scrape_configs:
  - job_name: "kudu"
    metrics_path: "/metrics_prometheus"
    static_configs:
      - targets: ["master-1:8051", "master-2:8051", "master-3:8051"]
        labels:
          group: "masters"
      - targets: ["tserver-1:8050", "tserver-2:8050", "tserver-3:8050"]
        labels:
          group: "tservers"
-
If your cluster uses automated service discovery, use the
http_sd_configs parameter instead of static_configs.
The following example shows an HTTP service discovery configuration:
global:
  scrape_interval: 15s
  evaluation_interval: 15s

scrape_configs:
  - job_name: "kudu"
    metrics_path: "/metrics_prometheus"
    http_sd_configs:
      - url: "http://master-1:8051/prometheus-sd"
      - url: "http://master-2:8051/prometheus-sd"
      - url: "http://master-3:8051/prometheus-sd"
-
Start the Prometheus service.
If you use a custom configuration file path, run the following command:
prometheus --config.file="<custom_path>/prometheus.yml"
-
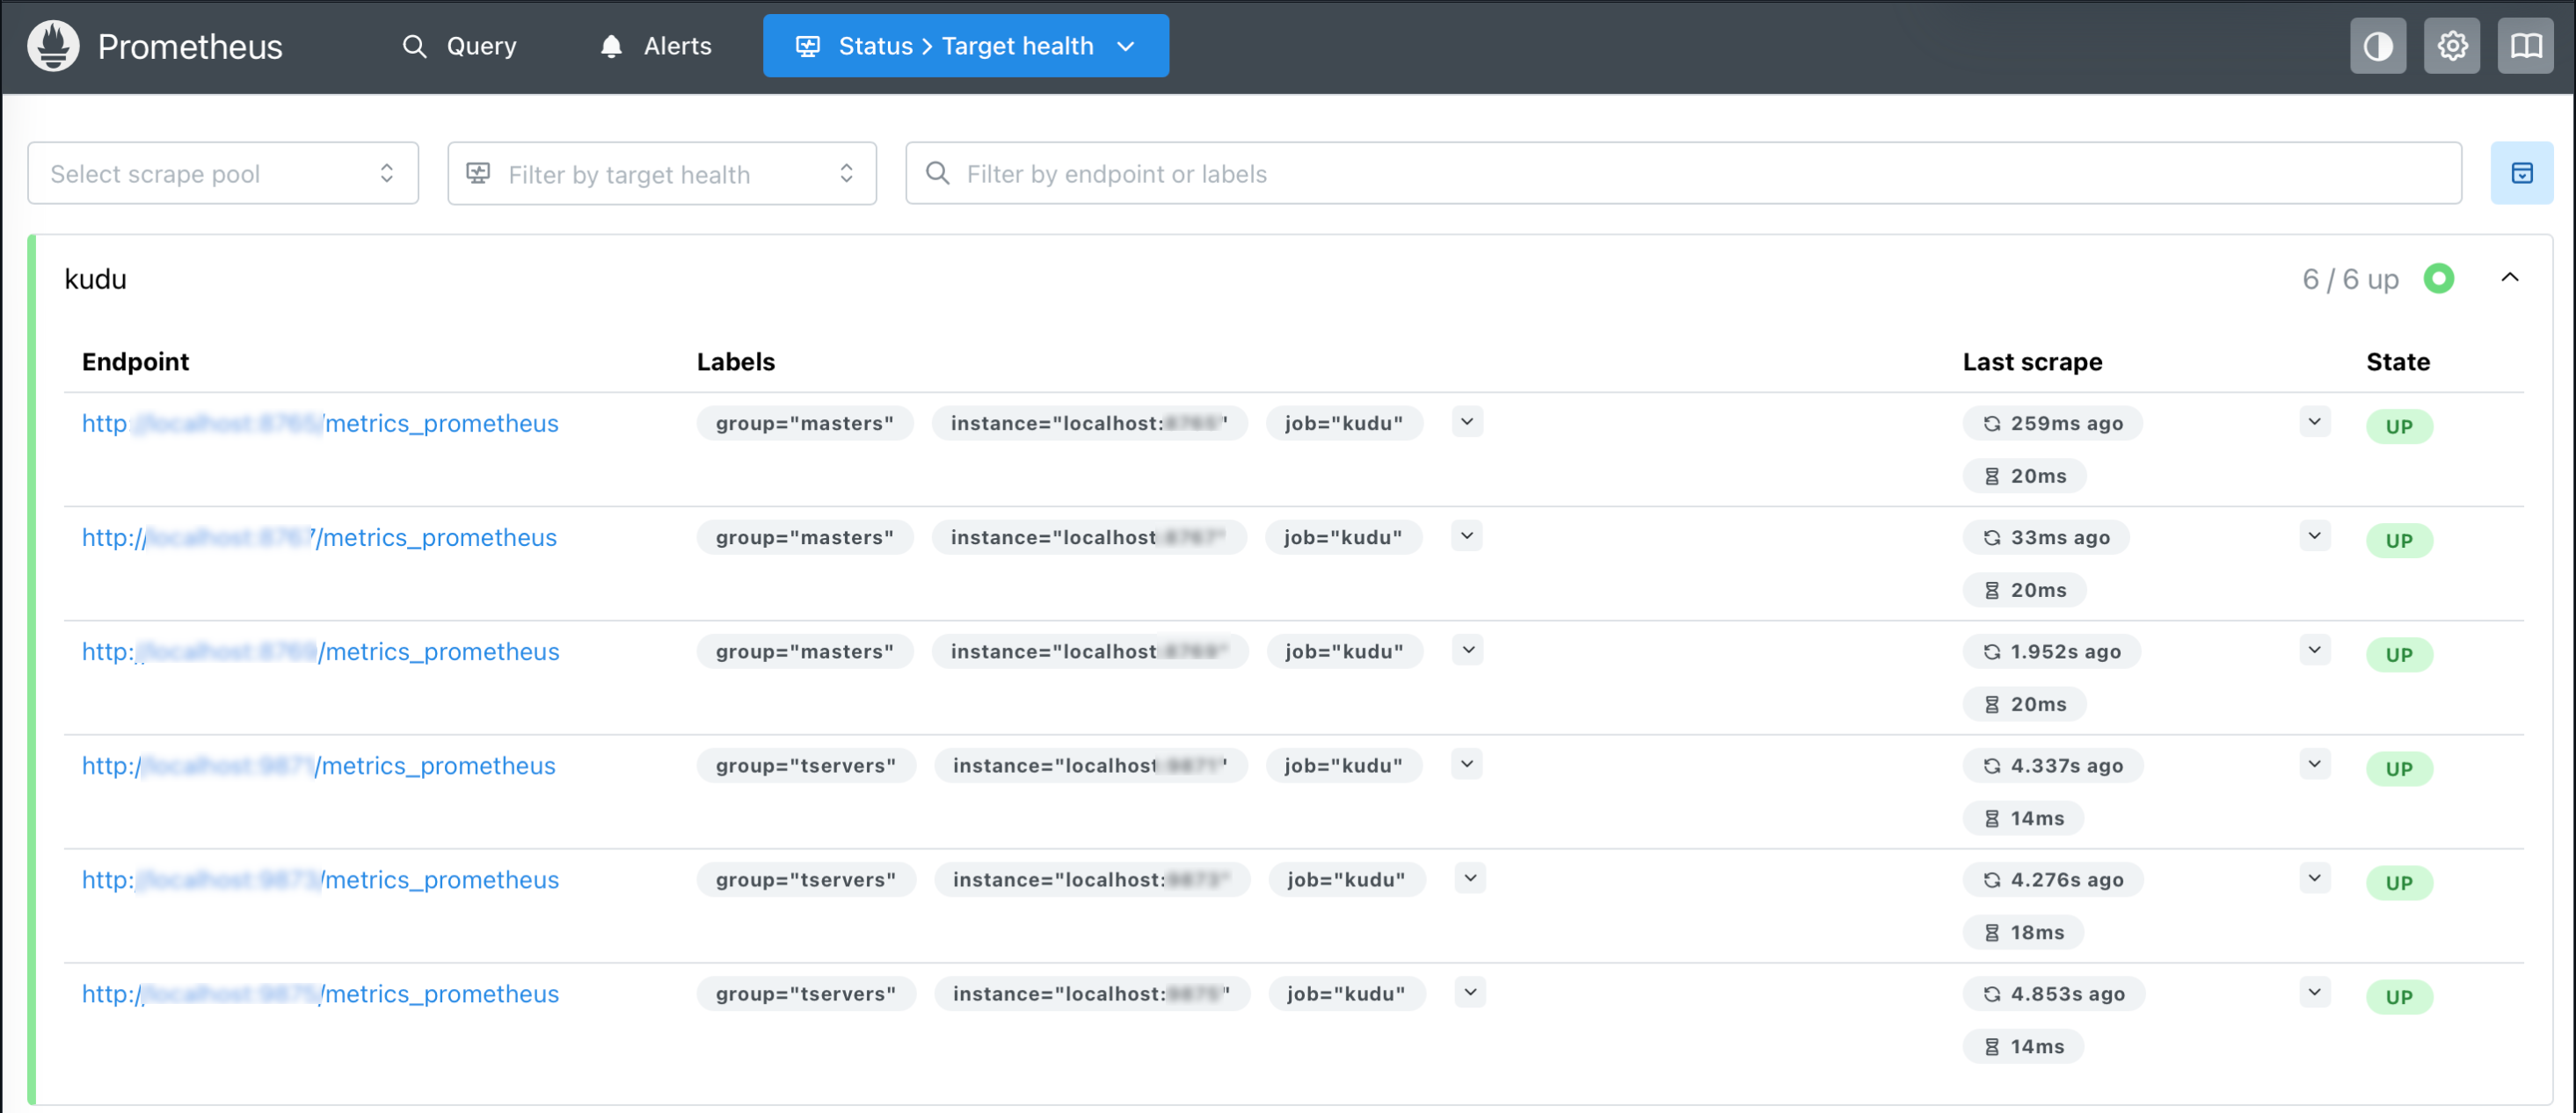
Access the Prometheus user interface and check the Status Targets page to verify that the Kudu daemons are connected.