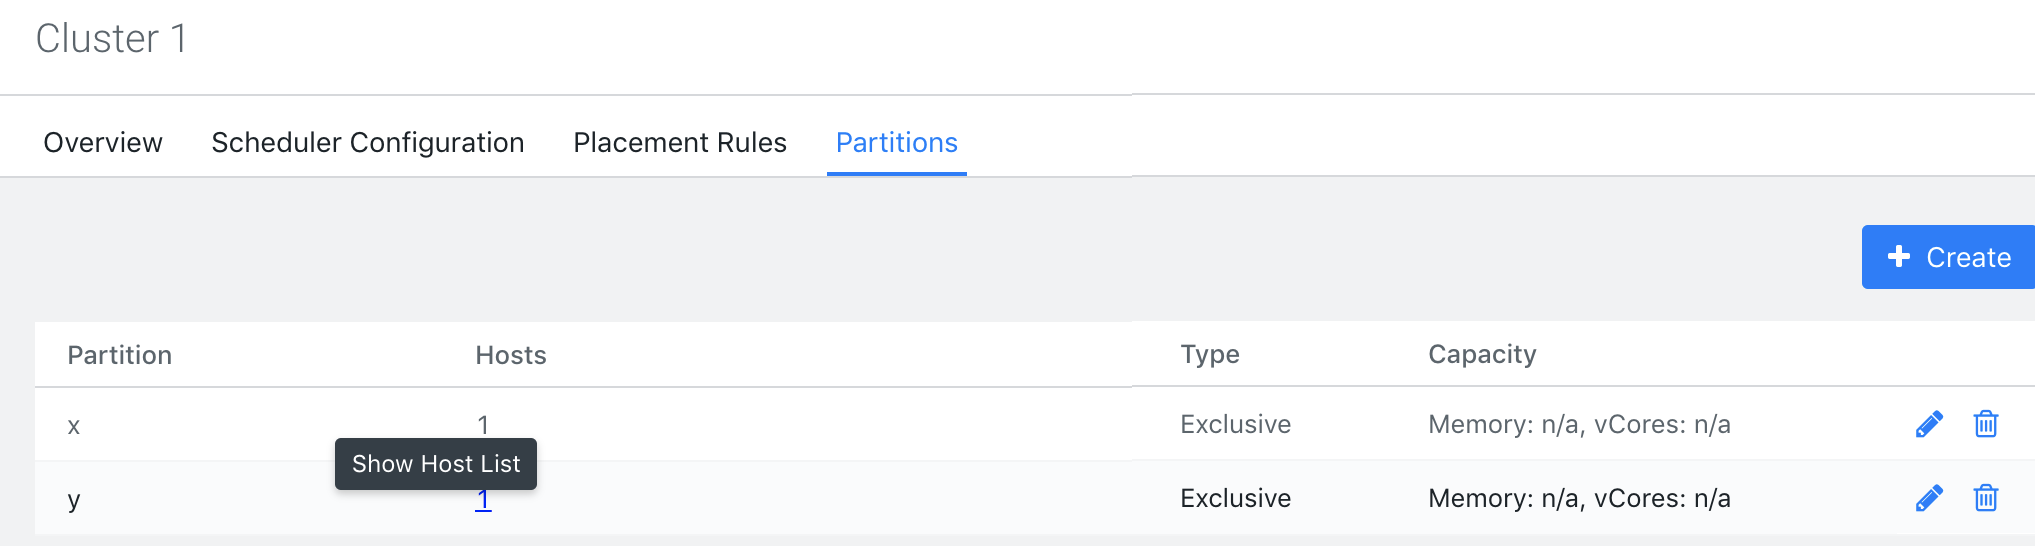
Viewing partitions
You can view the list of available partitions in the cluster. For each partition, it lists the number of associated nodes under the Hosts column along with the partition type and capacity.
-
In Cloudera Manager, select the Clusters > YARN Queue Manager UI service. A graphical queue hierarchy is displayed in the Overview tab.
-
Click the Partitions tab. A list of existing partitions is displayed.
-
Optionally, you can click on the number listed in the Host column to view the associated nodes.
View Node Label Assignments
You can use the following commands to view information about partitions.
-
List all running nodes in the cluster:
yarn node -listExample:
[root@node-1 /]# yarn node -list
14/11/21 12:14:06 INFO impl.TimelineClientImpl: Timeline service address: http://node-1.example.com:8188/ws/v1/timeline/
14/11/21 12:14:07 INFO client.RMProxy: Connecting to ResourceManager at node-1.example.com/240.0.0.10:8032
Total Nodes:3
 Node-Id Node-State Node-Http-Address Number-of-Running-Containers
node-3.example.com:45454 RUNNING node-3.example.com:50060 0
node-1.example.com:45454 RUNNING node-1.example.com:50060 0
node-2.example.com:45454 RUNNING node-2.example.com:50060 0
-
List the status of a node (includes partition):
yarn node -status
                     <Node_ID>
Example:
[root@node-1 /]# yarn node -status node-1.example.com:45454
14/11/21 06:32:35 INFO impl.TimelineClientImpl: Timeline service address: http://node-1.example.com:8188/ws/v1/timeline/
14/11/21 06:32:35 INFO client.RMProxy: Connecting to ResourceManager at node-1.example.com/240.0.0.10:8032
Node Report :
 Node-Id : node-1.example.com:45454
 Rack : /default-rack
 Node-State : RUNNING
 Node-Http-Address : node-1.example.com:50060
 Last-Health-Update : Fri 21/Nov/14 06:32:09:473PST
 Health-Report :
 Containers : 0
 Memory-Used : 0MB
 Memory-Capacity : 1408MB
 CPU-Used : 0 vcores
 CPU-Capacity : 8 vcores
 Node-Labels : x
Partitions are also displayed in the ResourceManager UI on the Nodes and Scheduler pages.