Proactive monitoring
You can define alert rules for your CDP Private Cloud Data Services deployment based on PromQL expressions. The alerts are automatically triggered when specific events occur in your deployment. You can view the triggered alerts on the Management Console dashboard. Any alert receivers that you have already configured start sending notifications to specified endpoints.
Configuring alert rules
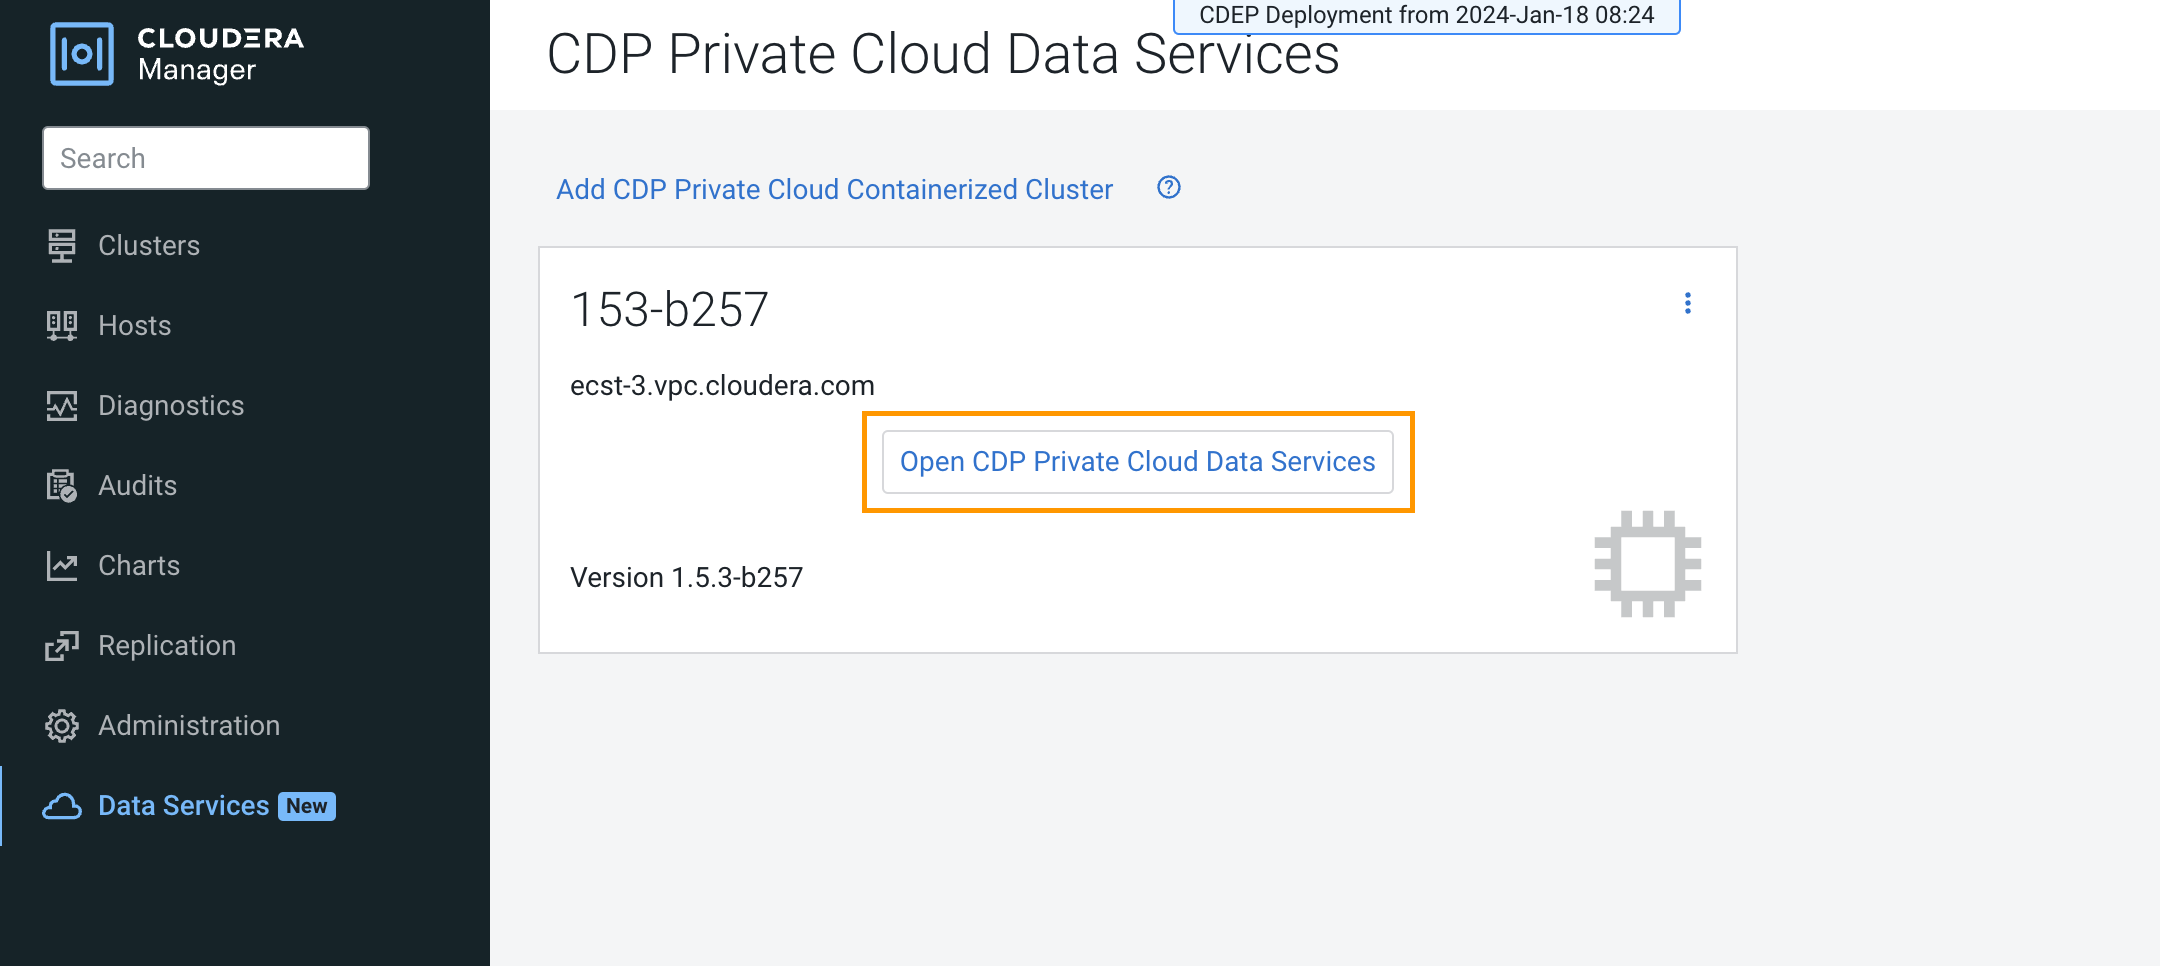
- To access the Management Console, click Data Services in Cloudera
Manager, then click Open CDP Private Cloud Data Services, and then
select Management Console.

- On the Management Console home page, select Administration > Alerts.
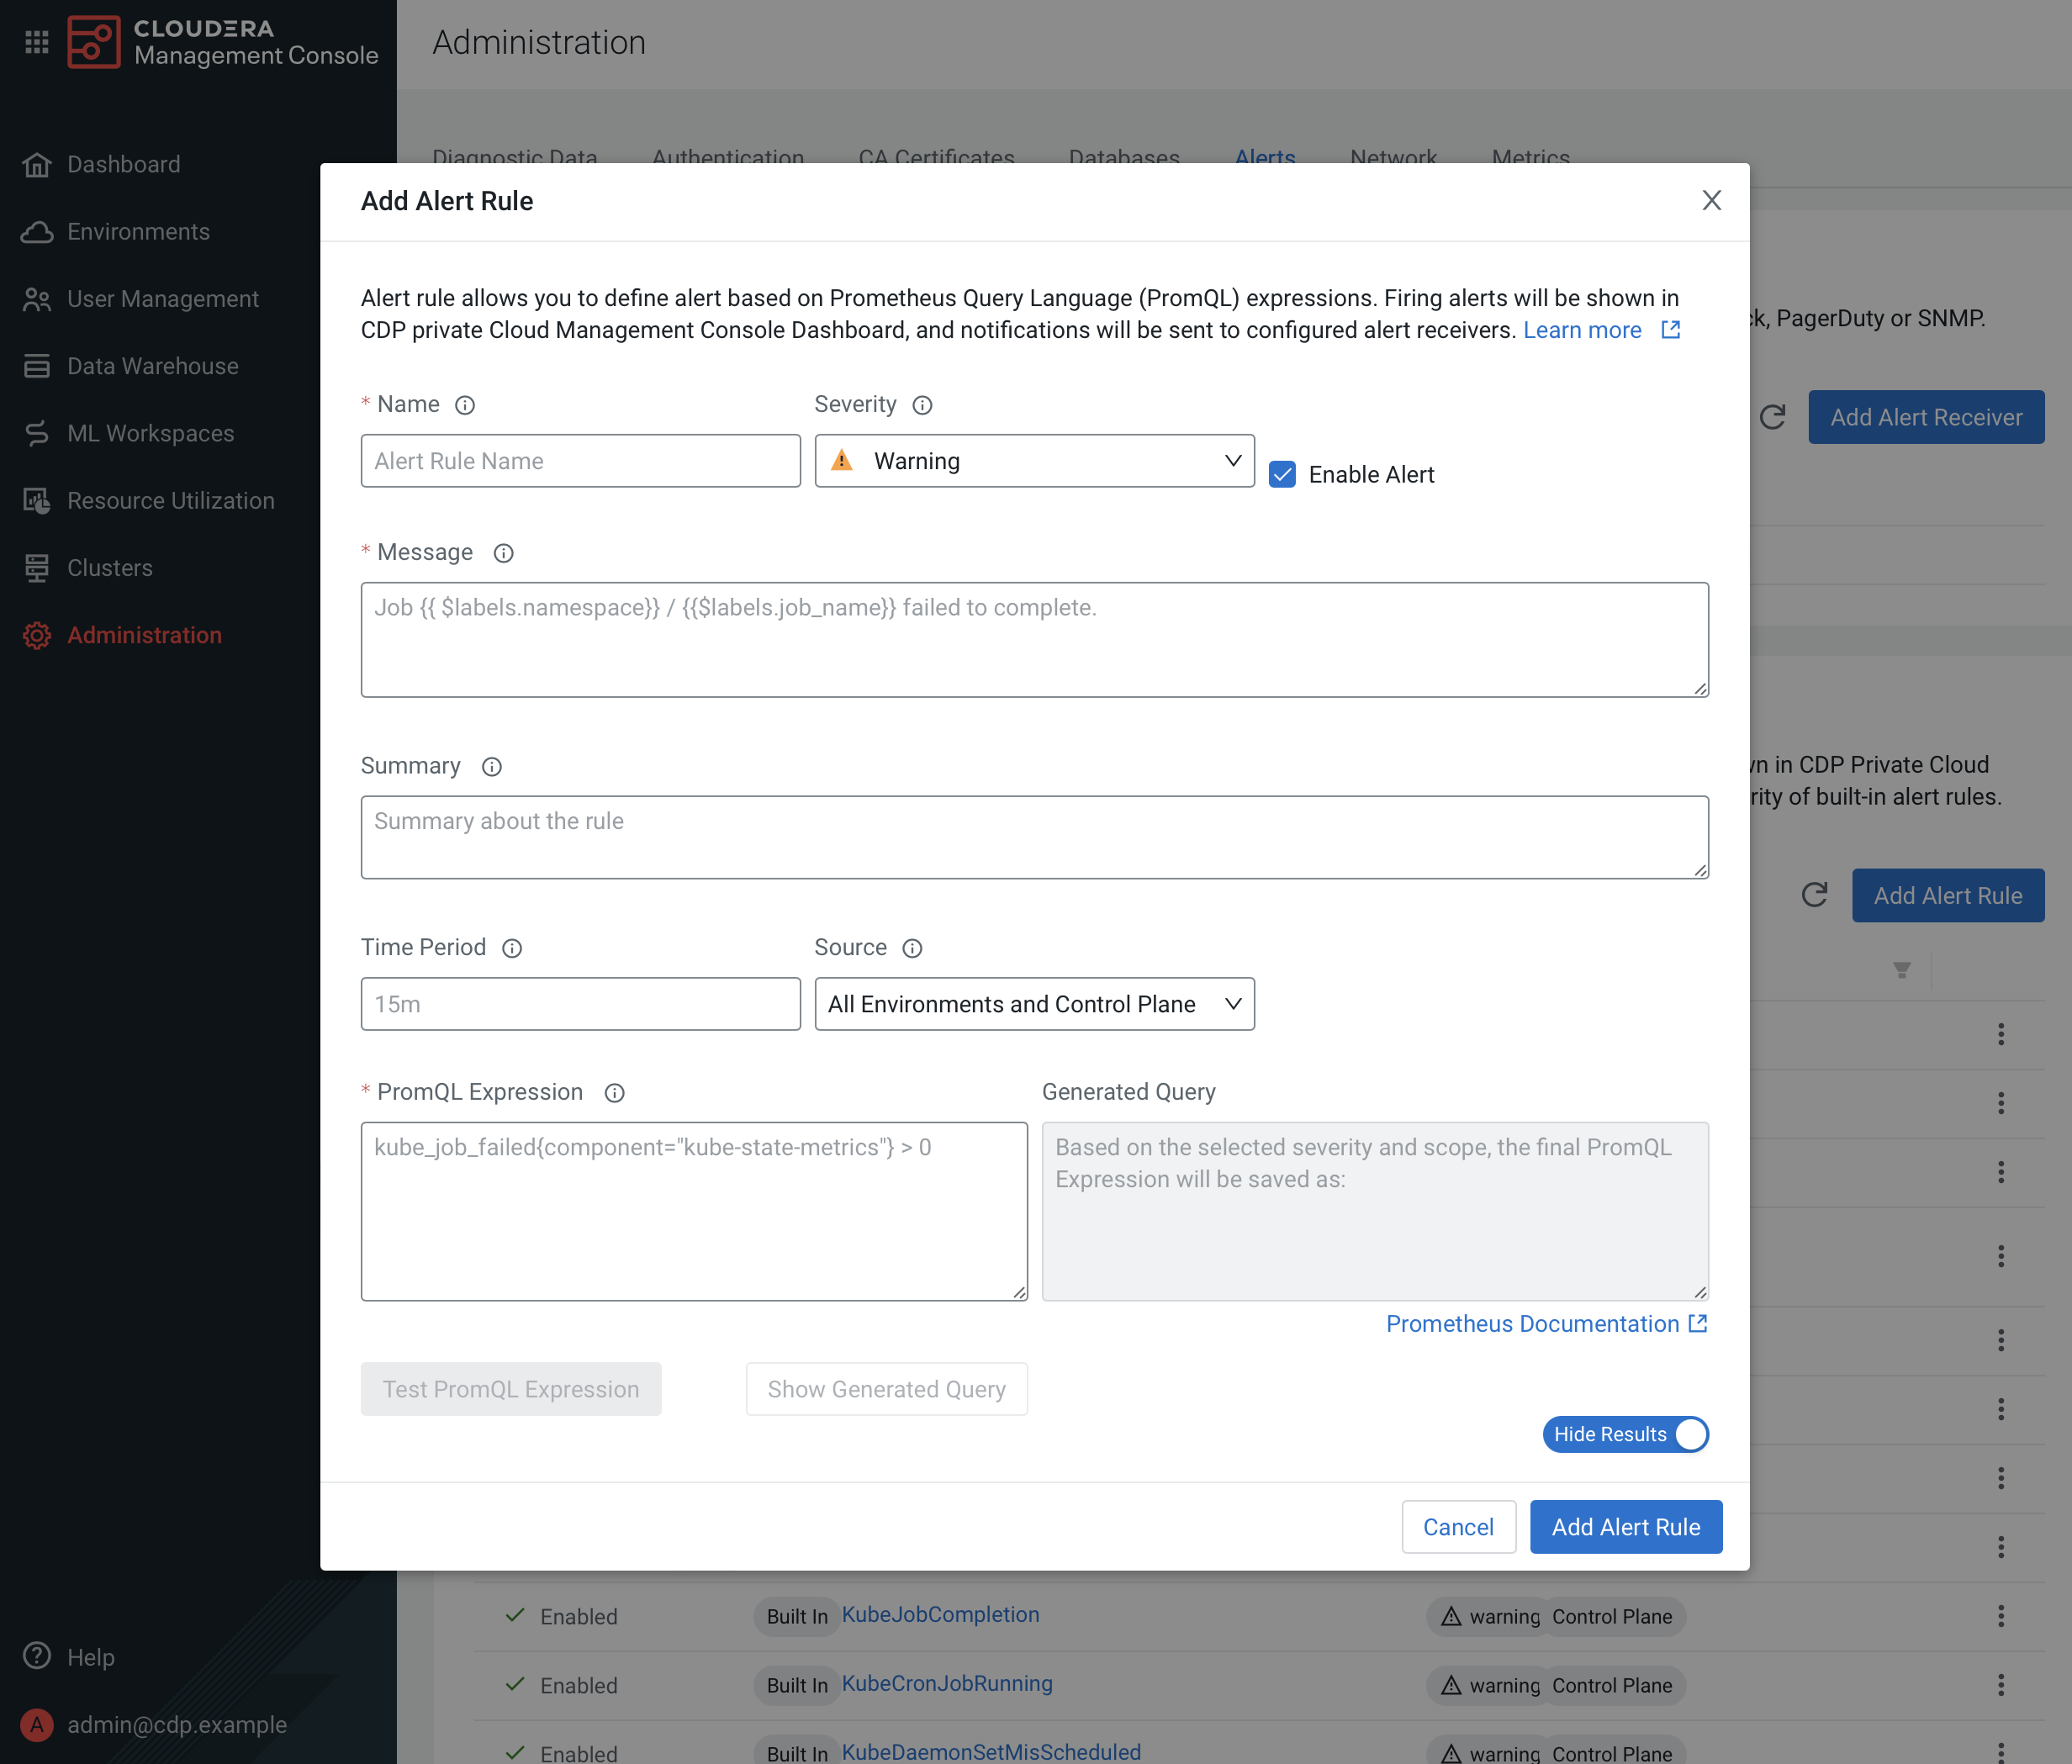
- On the Alerts page, click Add Alert Rule.

- On the Add Alert Rule pop-up, enter the following alert rule options (required fields
are indicated in bold) then click Add Alert Rule.
Field Description Name The name of the alert rule. You cannot use spaces or special characters in the name. Severity Specify the severity: Critical or Warning. Enable Alert Select this checkbox to enable the alert rule. Message The alert rule text. You can use PromQL labels to denote entities such as jobs in the text. For more information about using PromQL labels, see Alerting Rules.
Summary A brief summary of the alert rule. Time Period The duration for which the PromQL expression must be true. If the expression continues to be true after the specified duration, the configured alert is automatically triggered. Source The CDP Private Cloud components for which the alert rule applies. You can select one of the following options as the source: - All Environments and Control Plane
- Environments
- Control Plane
- A specific environment from the list of configured environments
PromQL Expression The query expression in PromQL. The alert is issued when this expression is true for the time period specified in the For Clause. Generated Query The query that is generated for a selected workload type depending on the specified PromQL expression. You can view the query by clicking Show Generated Query.
Test PromQL Expression You can click this option to test the query expression generated for the combination of a selected source and workload type. If you select one of All Environments and Control Plane, Environments, or Control Plane as the source for the PromQL query, it runs only on the control plane. To run the query on an environment, you must select a specific environment as the source.
The new alert rule is listed on the Alerts page under Alerting Rules.