Generating and sharing dashboards
Use Cloudera Data Visualization to create dashboards from queries and share them with your stakeholders.
-
On the New Dataset pop-up, specify a Dataset
title.
Select From SQL from the Dataset Source drop-down list.Copy and paste the following query in the Enter SQL below field and click CREATE:
-- Number of passengers on the airline that have long, planned layovers for an international flight
SELECT
   a.leg1uniquecarrier as carrier,
   count(a.leg1uniquecarrier) as passengers
FROM
   `airline_ontime_orc`.unique_tickets a
where
   a.leg2deptime - a.leg1arrtime>90
group by
   a.leg1uniquecarrier
;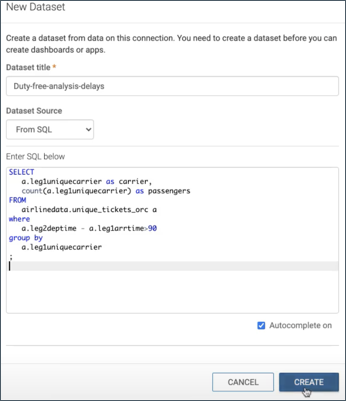
A new data set is created based on which you can create the visualization. -
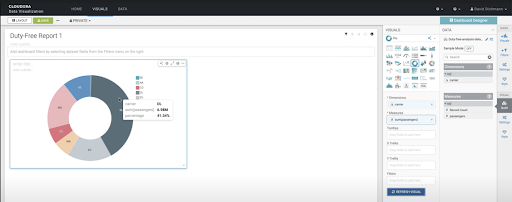
Select a visual type from the VISUALS menu, such as a
pie chart. Select the appropriate Dimensions and
Measures from the DATA menu,
and click REFRESH VISUAL.
The pie chart shows the airlines having the most passengers with long layovers on international flights.