Identifying Performance Trends
This task identifies performance trends over a selected time range.
You can identify trends as well as baselines by analyzing your engine’s or
cluster’s performance trends from the Trends chart widget and
the Trend tab. Where:
- The Trends time-series chart widget displays more detailed metrics about the processed jobs and queries and enables you to view historical trends for analysis when you select a predefined or custom time period from the Range filter list.
- The Trends tab displays the job or query's instances executed during the selected time range. Depending on the engine, the Trends page displays a job's historical trend from Duration, Data Input, and Data Output histogram charts or lists the runs of the query to show how its performance changes overtime.
-
For any Failed Jobs or Queries and for any slow jobs or queries, labeled Job
Duration or Query Active Time, select the number under the aforementioned
labels.
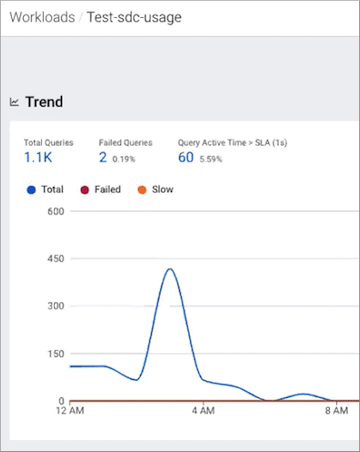
The following image shows the Total Queries, Failed Queries, and Query Active Time labels from a Workload View's Trend chart widget: