Identifying Resource Contention
This task identifies the resource usage and consumption of your workloads.
Describes how to use Workload Manager or Workload XM to identify workload resource consumption and contention problems by observing the types of resources and the amount of memory that is consumed.
- The Resource Consumption By Services chart widget, which is displayed in the cluster Summary page. It shows the CPU and memory consumption for each service across the time range you selected. Hover your mouse over the time line, to display the amount of CPU or memory, as a percentage, that is consumed by each of the cluster's services.
- The Resource Consumption By Nodes chart widget, which is displayed in the cluster Summary page. It shows the CPU and memory consumption for each node in the cluster. Hover your mouse over the time line, to display the amount of CPU or memory, as a percentage, that is consumed by each node and its services.
- The Memory Utilization chart widget, which is displayed in either the Impala engine or Workloads (Workload View) page. It shows the aggregated maximum amount of memory that is used by the queries on any node performing the processing. It helps you identify inefficient queries that are consuming the most amount of memory during processing and if you need to allocate more memory to continue running your queries.
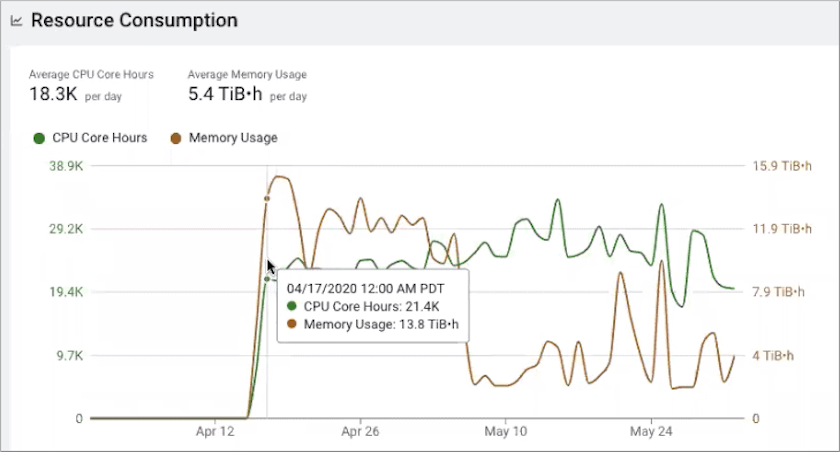
- The Resource Consumption chart widget, which is displayed in either the Impala engine or Workloads (Workload View) page. It shows the concurrent use of CPU and memory consumption for a workload across the time line you selected.
-
Record any above average CPU and memory usage.
For example, the following Resource Consumption chart widget image shows spikes when CPU and memory usage is high. This could be due to several job events occurring at the same time. The memory usage drops significantly around May 10th, which will need further investigation.
To rule out any serious problems, Cloudera recommends monitoring your memory and CPU usage from one of the aforementioned resource chart widgets. As part of your migration plan, Cloudera recommends eliminating any resource contention before you migrate. Otherwise, these problems will resurface in Cloudera.