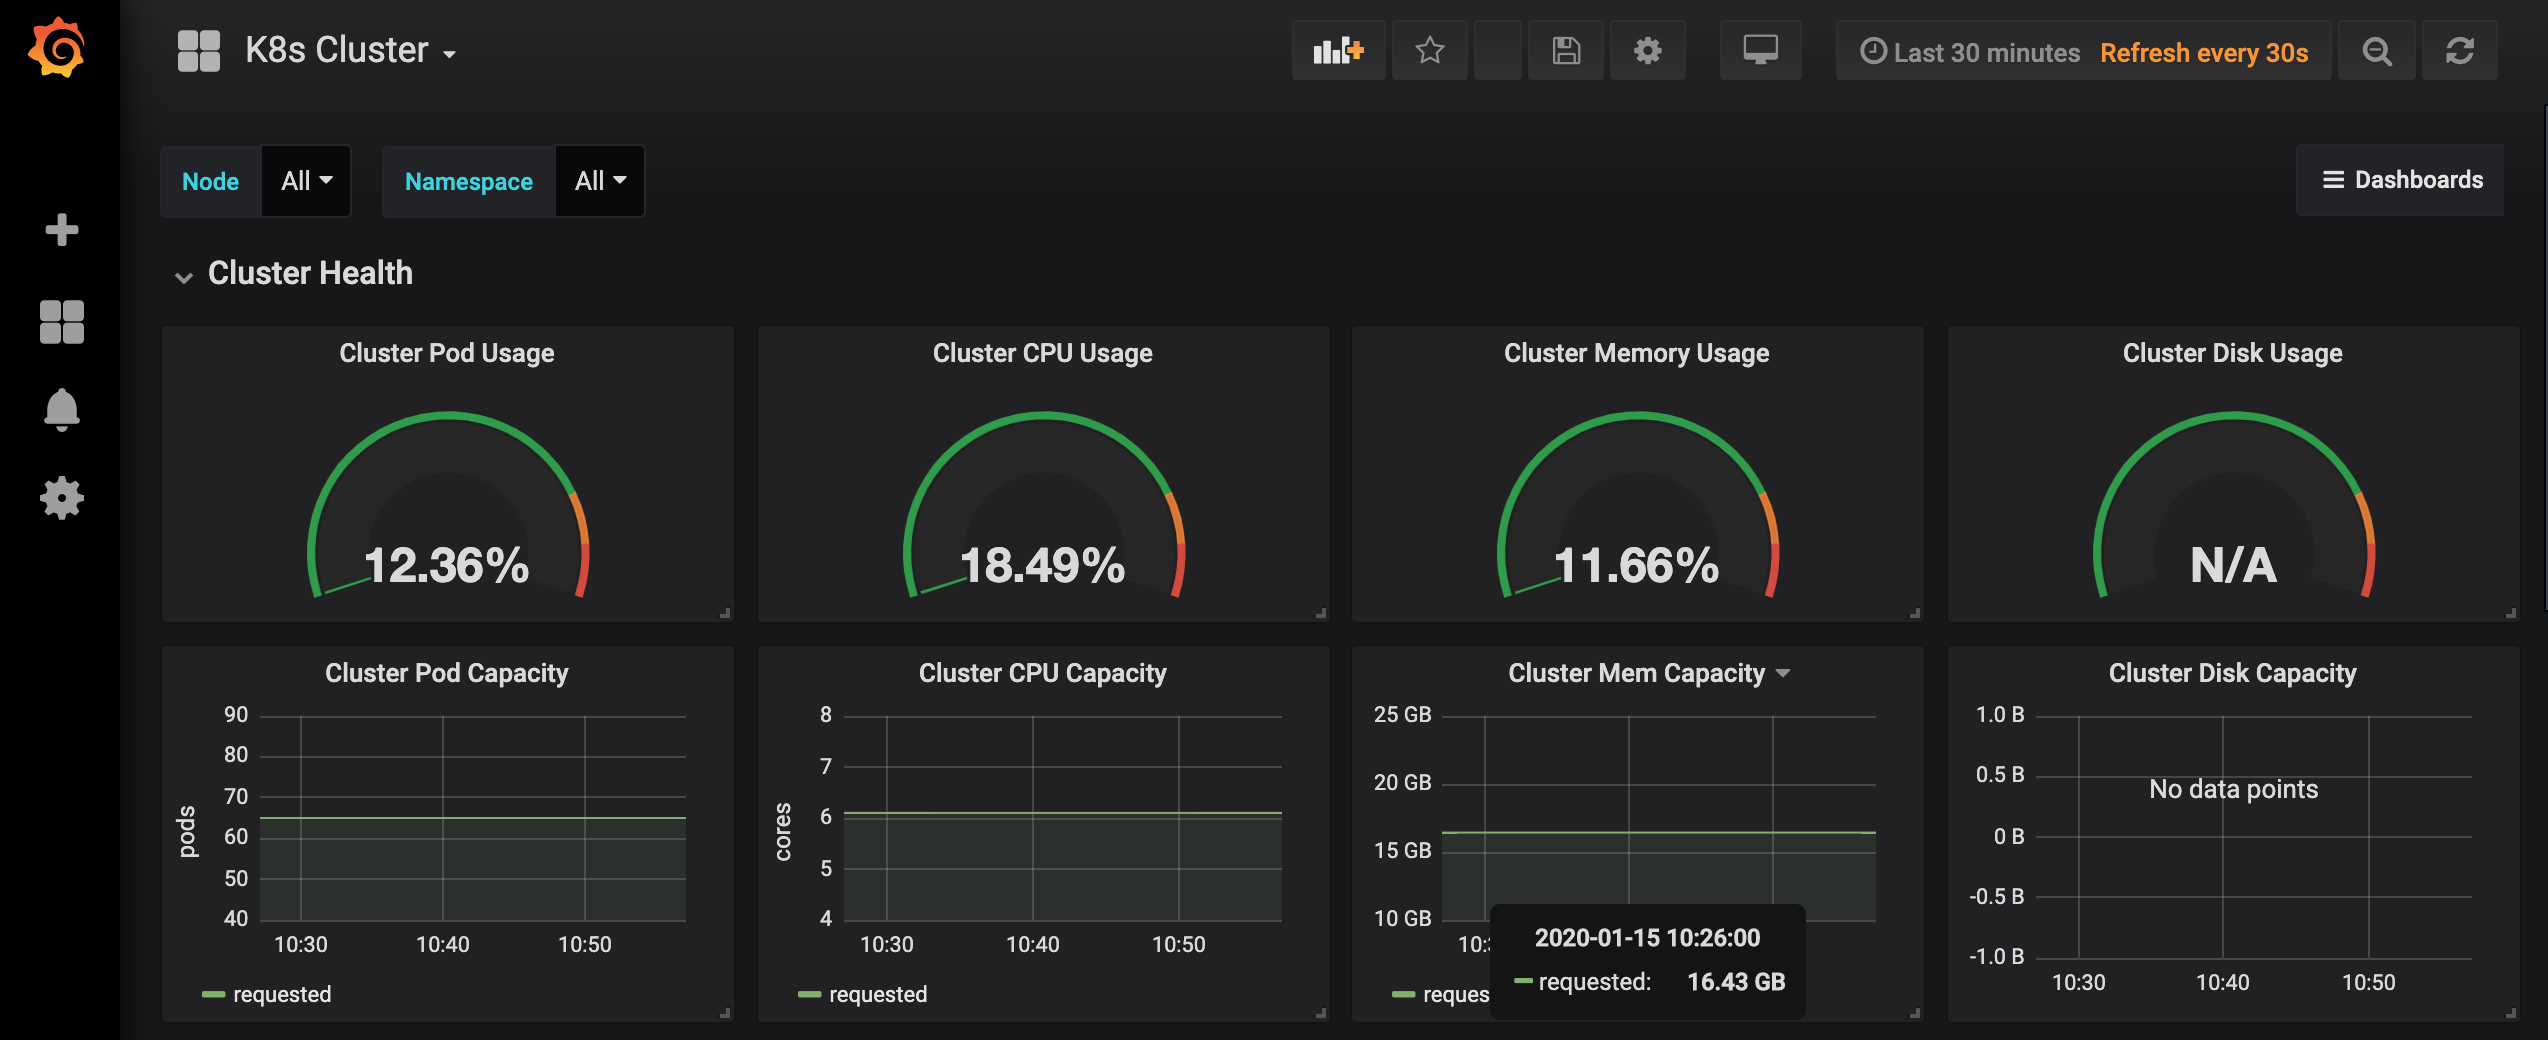
Accessing the Grafana Dashboard To access the Grafana dashboard for your deployment. Log into Cloudera Data Science Workbench with site administrator privileges. Click Admin > Overview. Click the Grafana dashboard link. This will take you to the built-in Grafana server. To see all the available dashboards, click Home > K8 Cluster (or K8s Containers or K8s Node). Parent topic: Cluster Monitoring with Grafana