Monitoring Cloudera Data Science Workbench Usage
There are at least three ways that an Administrator can view the cluster resources and utilization:
- The tab. This page displays basic information about your deployment, such as the number of users signed up, the number of teams and projects created, memory used, and some average job scheduling and run times.
- The widget. This widget will show "Used" and "Available" resources for the entire cluster, as well as the logged in user's resources.
Required Role: Site Administrator
- CPU Time: The amount of time, rounded to one hour increments, that a workspace is utilizing a CPU. If the session uses 100% of CPUs available, and there are two CPUs in the instance, then one hour of use results in two hours of CPU time. Time spent idling also counts towards this metric. This metric is tracked as a 30-day moving average.
- GPU Time: The same as CPU Time, but with GPUs.
- Memory Time: 1 GB of memory allocated to the user’s engines per hour. If a 2 GB session is used for one hour, it is counted as two hours of memory time. This metric is also tracked as a 30-day moving average.
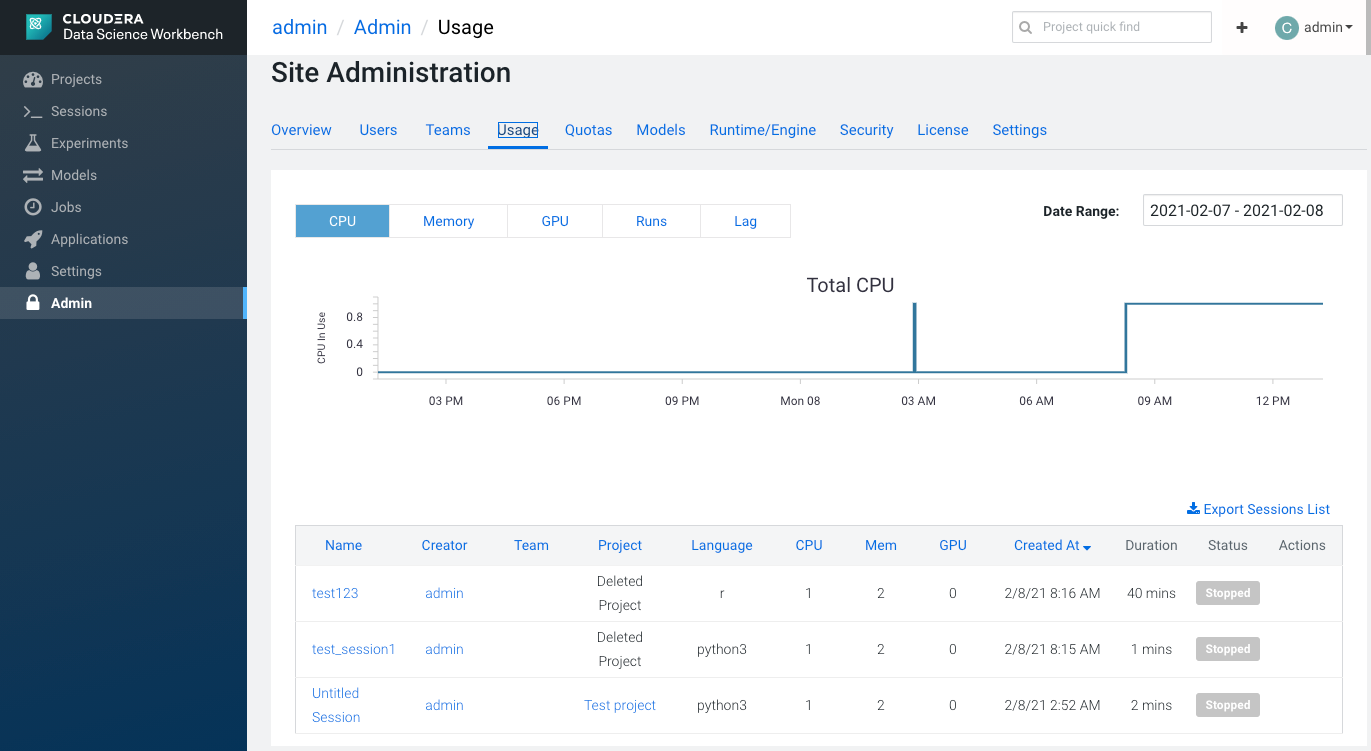
The tab of the dashboard displays the following time series charts. These graphs should help site administrators identify basic usage patterns, understand how cluster resources are being utilized over time, and how they are being distributed among teams and users.
-
CPU - Total number of CPUs requested by sessions running at this time.
Note that code running inside an n-CPU session, job, experiment or model replica can access at least n CPUs worth of CPU time. Each user pod can utilize all of its host's CPU resources except the amount requested by other user workloads or Cloudera Data Science Workbench application components. For example, a 1-core Python session can use more than 1 core if other cores have not been requested by other user workloads or CDSW application components.
- Memory - Total memory (in GiB) requested by sessions running at this time.
- GPU - Total number of GPUs requested by sessions running at this time.
- Runs - Total number of sessions and jobs running at this time.
-
Lag - Depicts session scheduling and startup times.
- Scheduling Duration: The amount of time it took for a session pod to be scheduled on the cluster.
- Starting Duration: The amount of time it took for a session to be ready for user input. This is the amount of time since a pod was scheduled on the cluster until code could be executed.
The Export Sessions List provides a CSV export file of the columns listed in the table. It is important to note that the exported duration column is in seconds for a more detailed output.