Hue overview
Hue is a web-based interactive query editor that enables you to interact with databases and data warehouses. Data architects, SQL developers, and data engineers use Hue to create data models, clean data to prepare it for analysis, and to build and test SQL scripts for applications.
- Business Analysts
- Data Engineers
- Data Scientists
- Power SQL users
- Database Administrators
- SQL Developers
Business Analysts (BA) are tasked with exploring and cleaning the data to make it more consumable by other stakeholders, such as the data scientists. With Hue, they can import data from various sources and in multiple formats, explore the data using File Browser and Table Browser, query the data using the smart query editor, and create dashboards. They can save the queries, view old queries, schedule long-running queries, and share them with other stakeholders in the organization. They can also use Cloudera Data Visualization to get data insights, generate dashboards, and help make business decisions.
Data Engineers design data sets in the form of tables for wider consumption and for exploring data, as well as scheduling regular workloads. They can use Hue to test various Data Engineering (DE) pipeline steps and help develop DE pipelines.
Data scientists predominantly create models and algorithms to identify trends and patterns. They then analyze and interpret the data to discover solutions and predict opportunities. Hue provides quick access to structured data sets and a seamless interface to compose queries, search databases, tables, and columns, and execute query faster by leveraging Tez and LLAP. They can run ad hoc queries and start the analysis of data as pre-work for designing various machine learning models.
Power SQL users are advanced SQL experts tasked with analyzing and fine-tuning queries to improve query throughput and performance. They often strive to meet the TPC decision support (TPC-DS) benchmark. Hue enables them to run complex queries and provides intelligent recommendations to optimize the query performance. They can further fine-tune the query parameters by comparing two queries, viewing the explain plan, analyzing the Directed Acyclic Graph (DAG) details, and using the query configuration details. They can also create and analyze materialized views.
The Database Administrators (DBA) provide support to the data scientists and the power SQL users by helping them to debug long-running queries. They can download the query logs and diagnostic bundles, export and process log events to a database, or download it in JSON file format for further analysis. They monitor all the queries running in the system and terminate long-running queries to free up resources. Additionally, they may also provision databases, manage users, monitor and maintain the database and schemas for the Hue service, and provide solutions to scale up the capacity or migrate to other databases, such as PostgreSQL, Oracle, MySQL, and so on.
All Hue users can download logs and share them with their DBA or Cloudera Support for debugging and troubleshooting purposes.
SQL Developers can use Hue to create data sets to generate reports and dashboards that are often consumed by other Business Intelligence (BI) tools, such as Cloudera Data Visualization.
Hue can sparsely be used as a Search Dashboard tool, usually to prototype a custom search application for production environments.
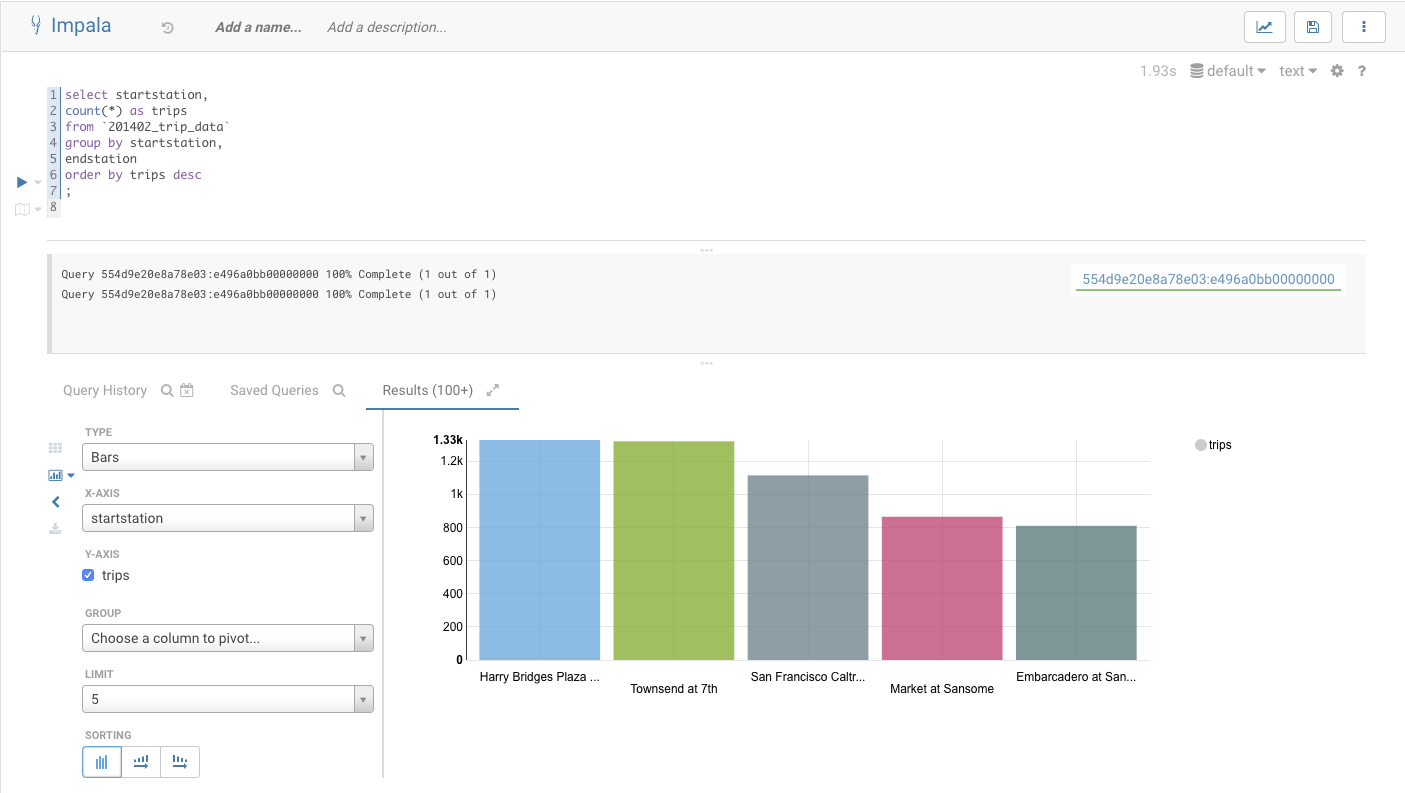
For example, the following image shows a graphical representation of Impala SQL query results that you can generate with Hue:

You can use Hue to:
-
Explore, browse, and import your data through guided navigation in the left panel of the page.
From the left panel, you can:
- Browse your databases
- Drill down to specific tables
- Discover indexes and HBase or Kudu tables
- Find documents
Objects can be tagged for quick retrieval, project association, or to assign a more "human-readable" name, if desired.
-
Query your data, create a custom dashboard, or schedule repetitive jobs in the central panel of the page.
The central panel of the page provides a rich toolset, including:- Versatile editors that enable you to create a wide variety of scripts.
- Dashboards that you can create "on-the-fly" by dragging and dropping elements into the central panel of the Hue interface. No programming is required. Then you can use your custom dashboard to explore your data.
- Schedulers that you can create by dragging and dropping, just like the dashboards feature. This feature enables you to create custom workflows and to schedule them to run automatically on a regular basis. A monitoring interface shows the progress, logs, and makes it possible to stop or pause jobs.
-
Get expert advice on how to complete a task using the assistance panel on the right.
The assistant panel on the right provides expert advice and hints for whatever application is currently being used in the central panel. For example, in the above image, Impala SQL hints are provided to help construct queries in the central panel.
- (Hive-only) View query details such as query information, visual explain, query timeline, query configuration, Directed Acyclic Graph (DAG) information, DAG flow, DAG swimlane, DAG counters, and DAG configurations.
- (Impala-only) View query details such as query type, duration, default database, request pool, CPU time, rows produced, peak memory, HDFS bytes read, coordinator details, execution plan, execution summary, and counters and metrics.
- (Hive-only) Terminate Hive queries.
- (Hive-only) Download debug bundles.
- Compare two queries.
- View query history.
