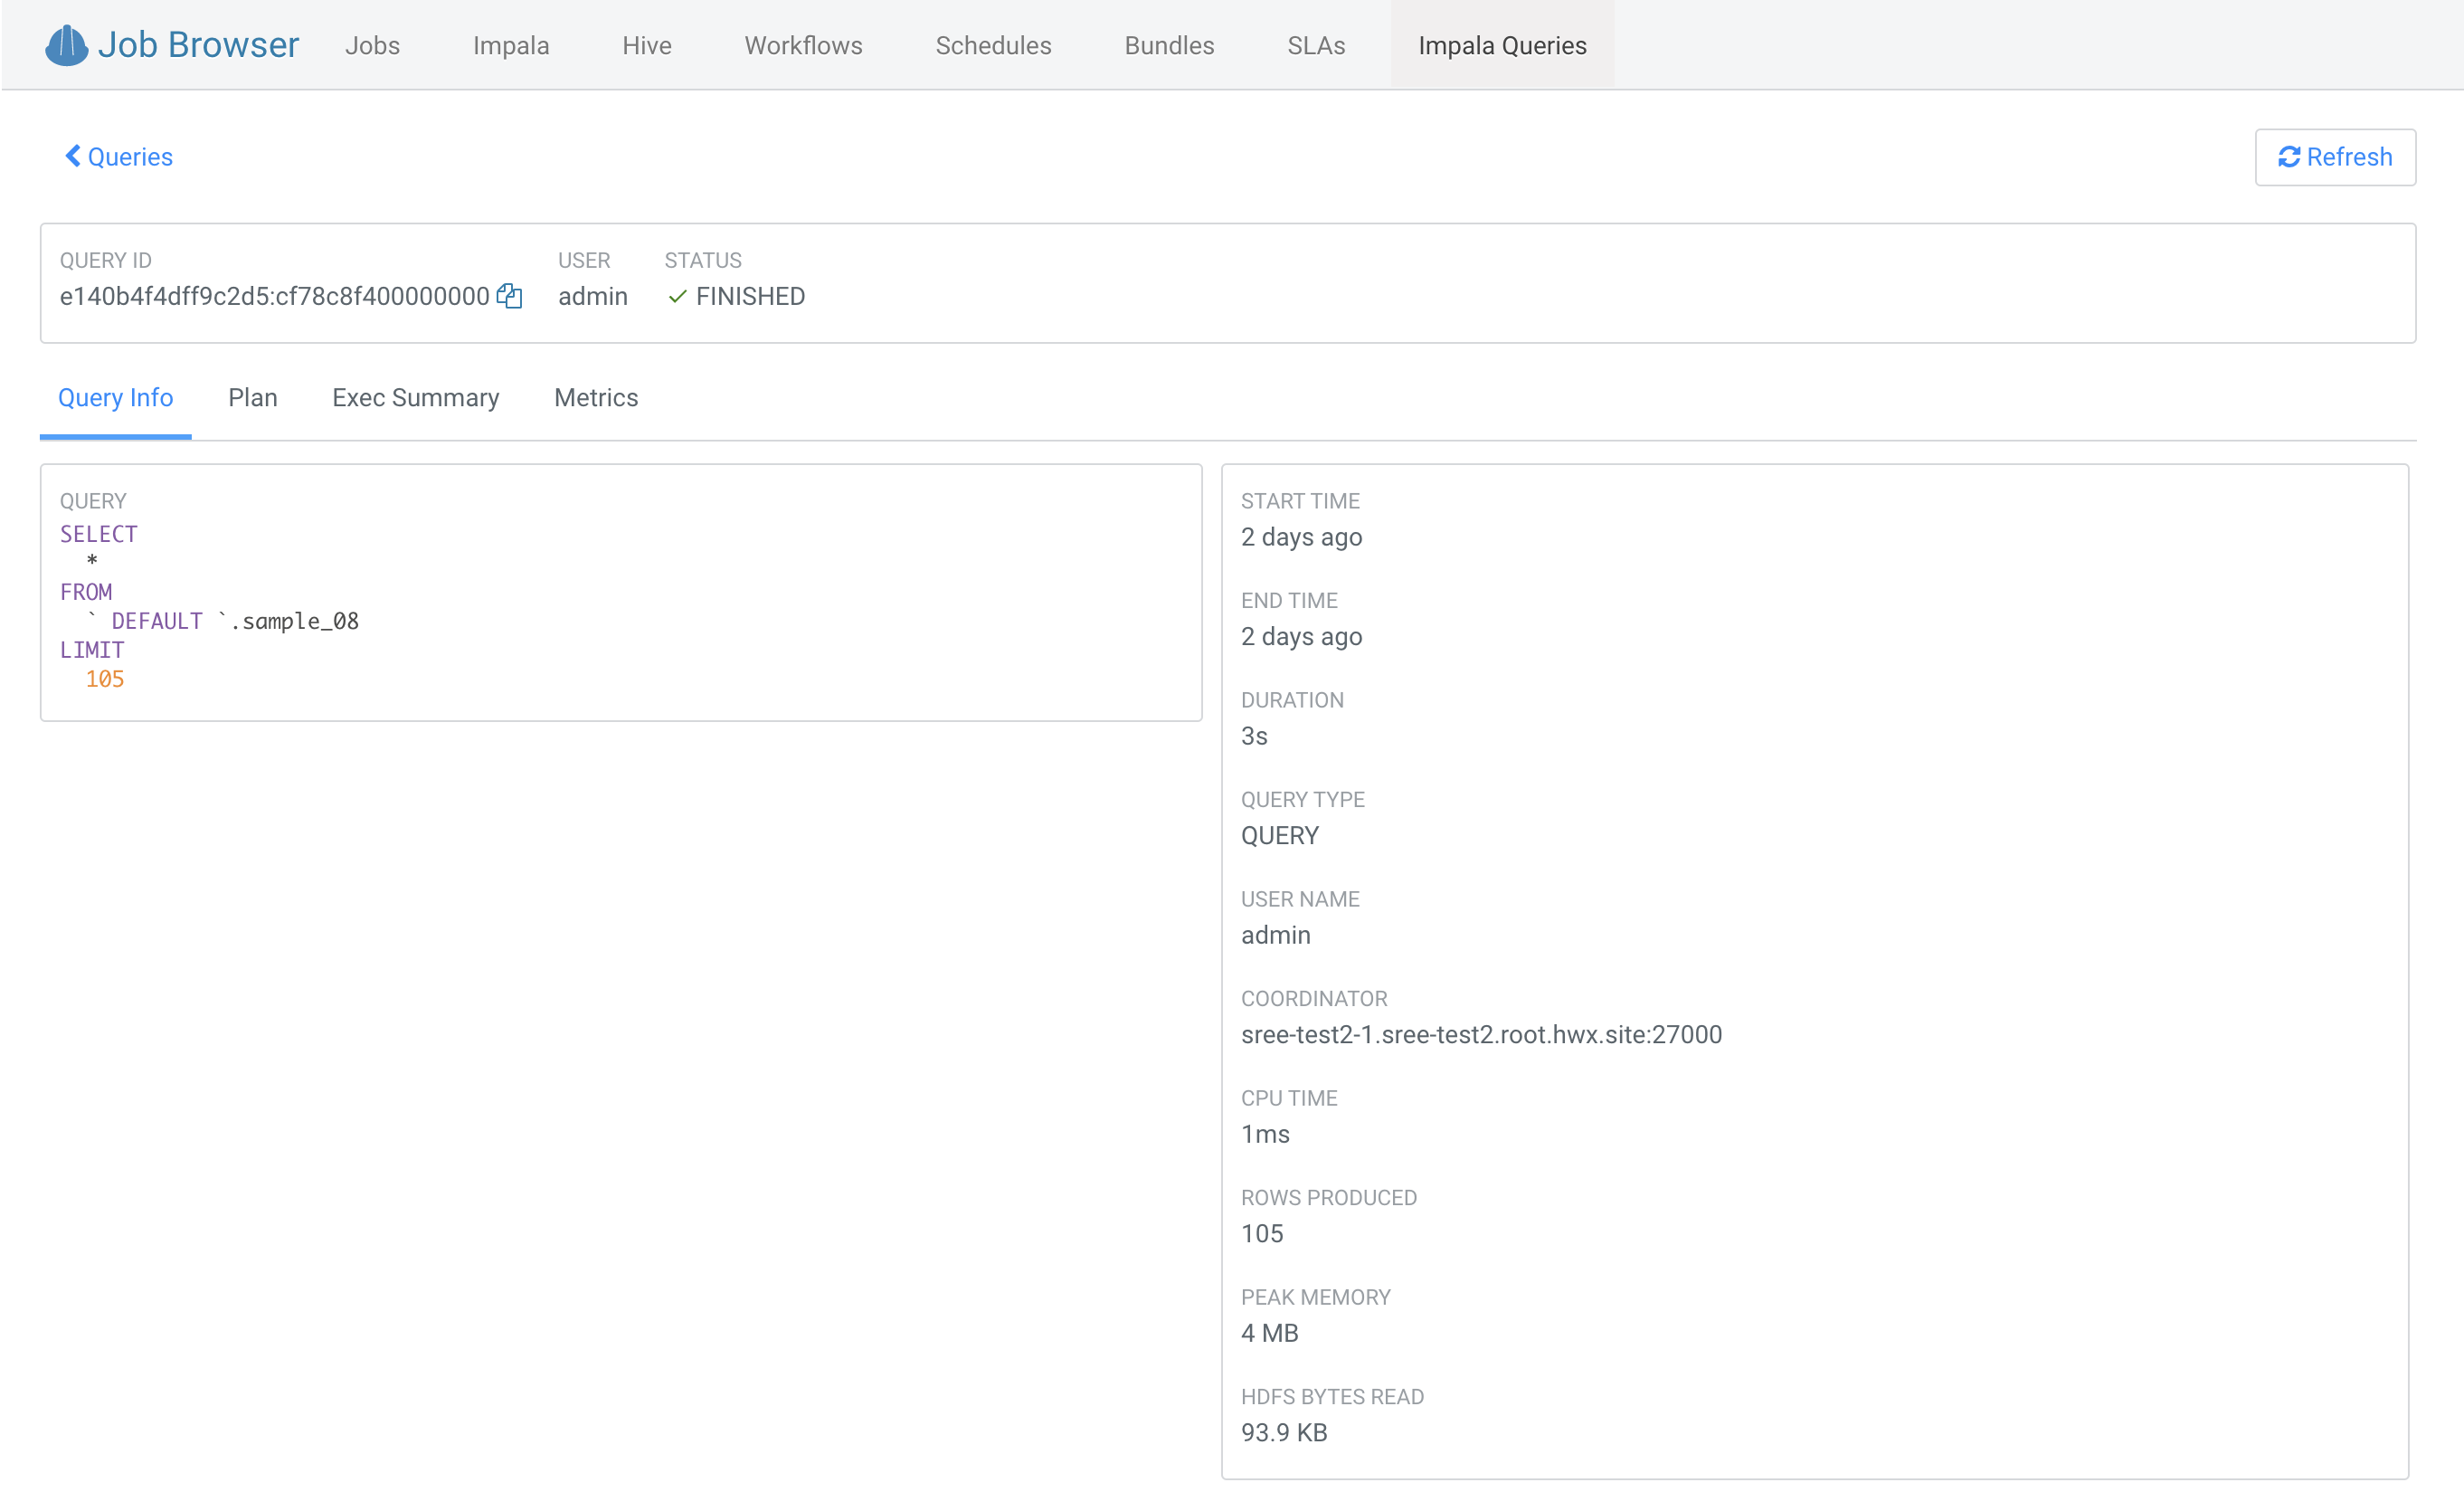
Viewing Impala query information
The Query Info tab in Data Explorer provides information such as, the Impala query ID, the user who executed the query, the start time, the end time, the total time taken to execute the query, the coordinator that received the query, CPU time, rows produced, peak memory, and HDFS bytes read.
-
Go to the Impala Queries tab and click on the query for
which you want to view the query details.
The following image shows the Query Info tab on the Data Explorer web interface: