Viewing the Impala query metrics
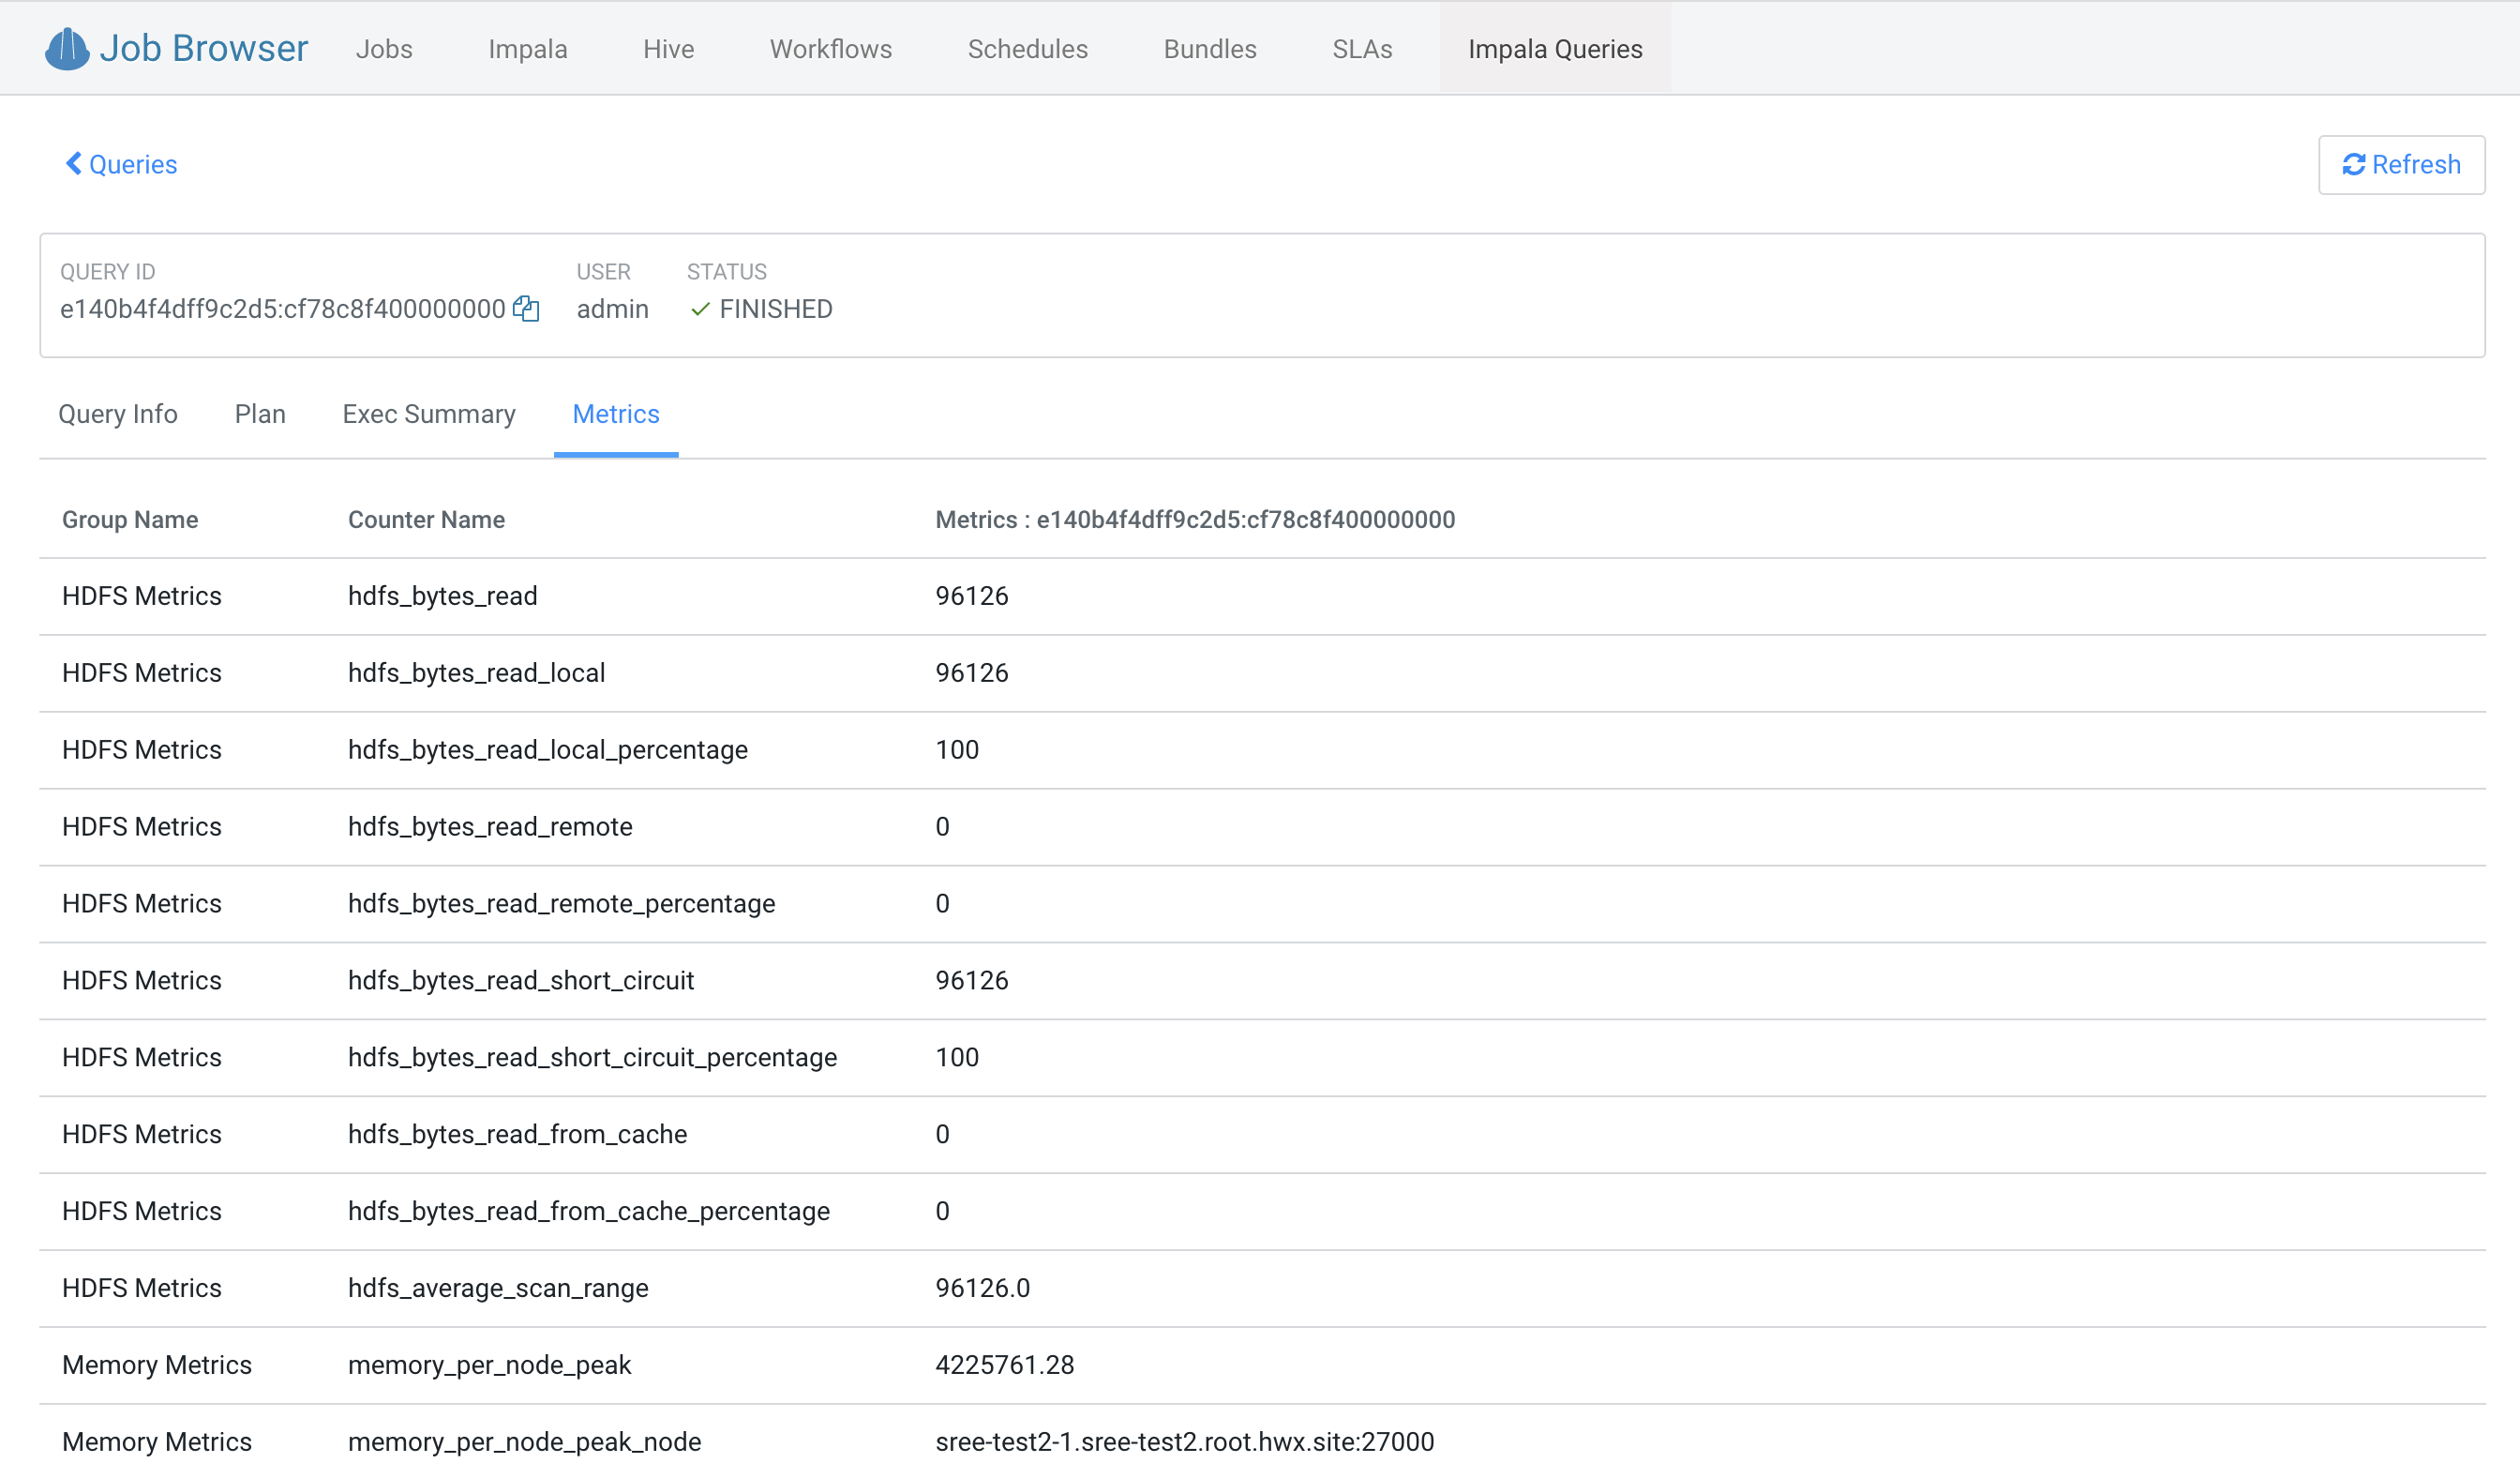
You can view detailed, aggregated metrics for various counters such as hdfs_bytes_read, memory_per_node_peak, thread_cpu_time, and so on, on the Metrics tab in Data Explorer.
-
Go to the Impala Queries tab and click on the query for
which you want to view the query metrics.
The following image shows the Metrics tab on the Data Explorer web interface: