Monitoring deployments in CEM
Learn the options, available in the Deployments Monitor screen, that
enables you to monitor C2 server and agent deployments. The Deployments Monitor
is the first page in the Cloudera Edge Management (CEM) UI.
Deployments Monitor screen. The Deployments Monitor screen
appears as shown in the following image: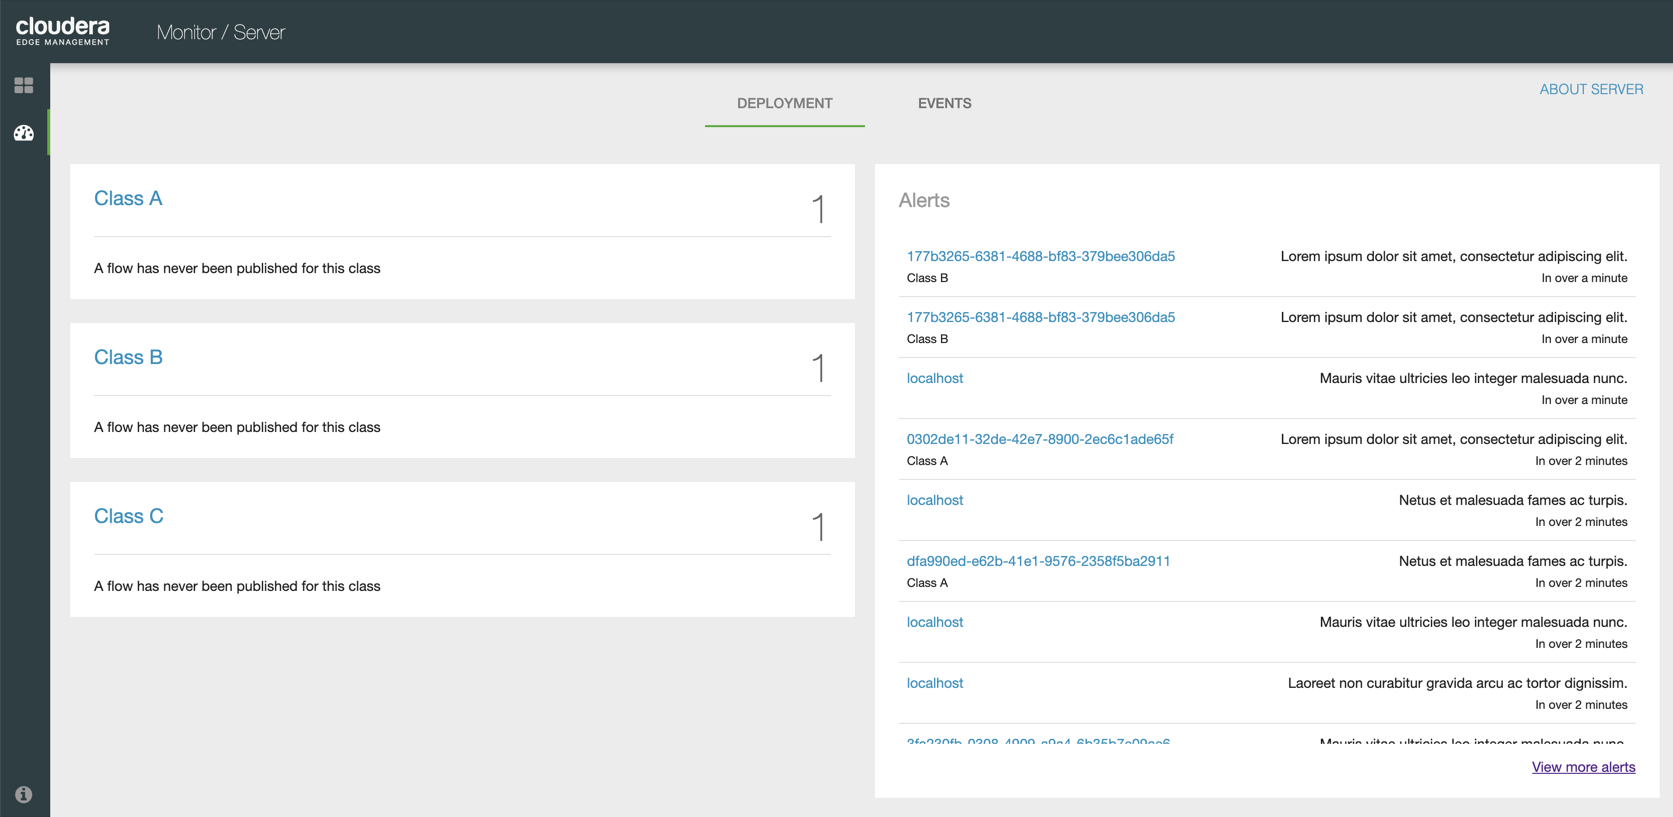
- Classes. The first column, from the left, displays the classes available in the system.
- Alerts. The Alerts column displays the alerts available in the system.
- About Server. Click the About Server link to fetch details about the
C2 server. The
About This Serverdialog displays the server URL, registry URL, registry bucket ID, and registry bucket name.Click OK to return to the
Deployments Monitorscreen.
Monitoring class details
The class column displays the class names that also act as links to navigate to more details about the classes. The column also displays the number of agents running in the class beside each class name. You can also view the number of agents that are currently not responding in a class.
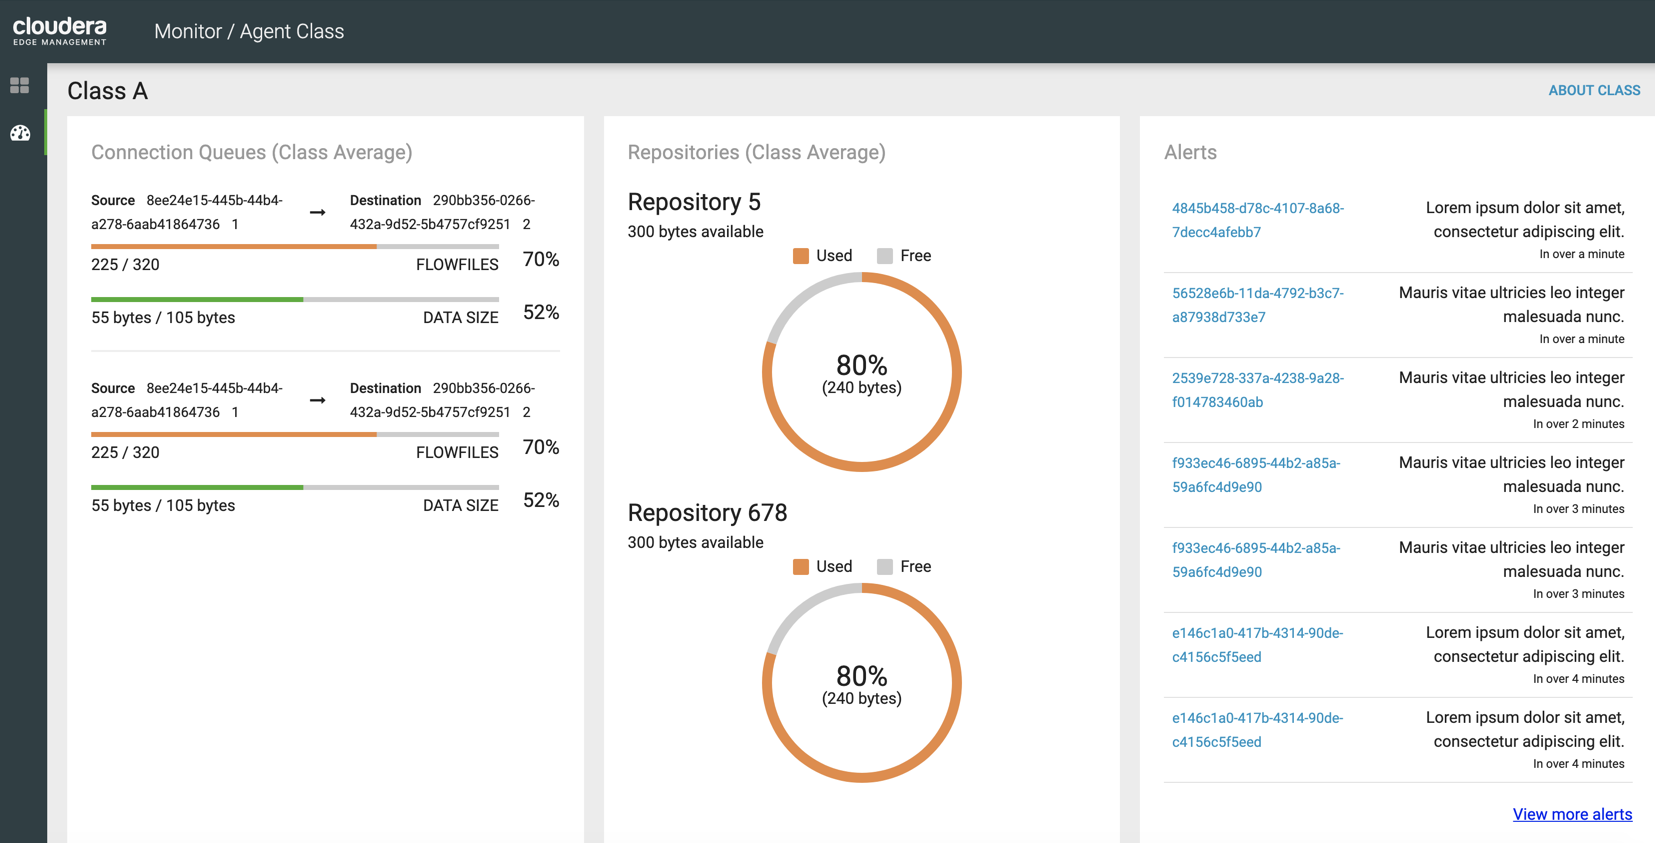
- Connection Queues (Class Average). Aggregate views of all the connections throughout the instances in the selected class.
- Repositories (Class Average). Usage details of the repositories the selected class is connected to.
- Alerts. Alerts available for the selected class.
- About Class. When you click the About Class link, the
About
              This Class
page appears which displays details about the class including flow name, latest version, registry ID, registry bucket, and Grafana dashboard link if you enabled it. For more information, see Monitoring Metrics with Grafana.
Monitoring alert details
The alert column displays the alert messages.
You can scroll through the Alert column to see more alerts in the system. Click the
View more alerts link to navigate to the Events
page to monitor C2 server and agent events.
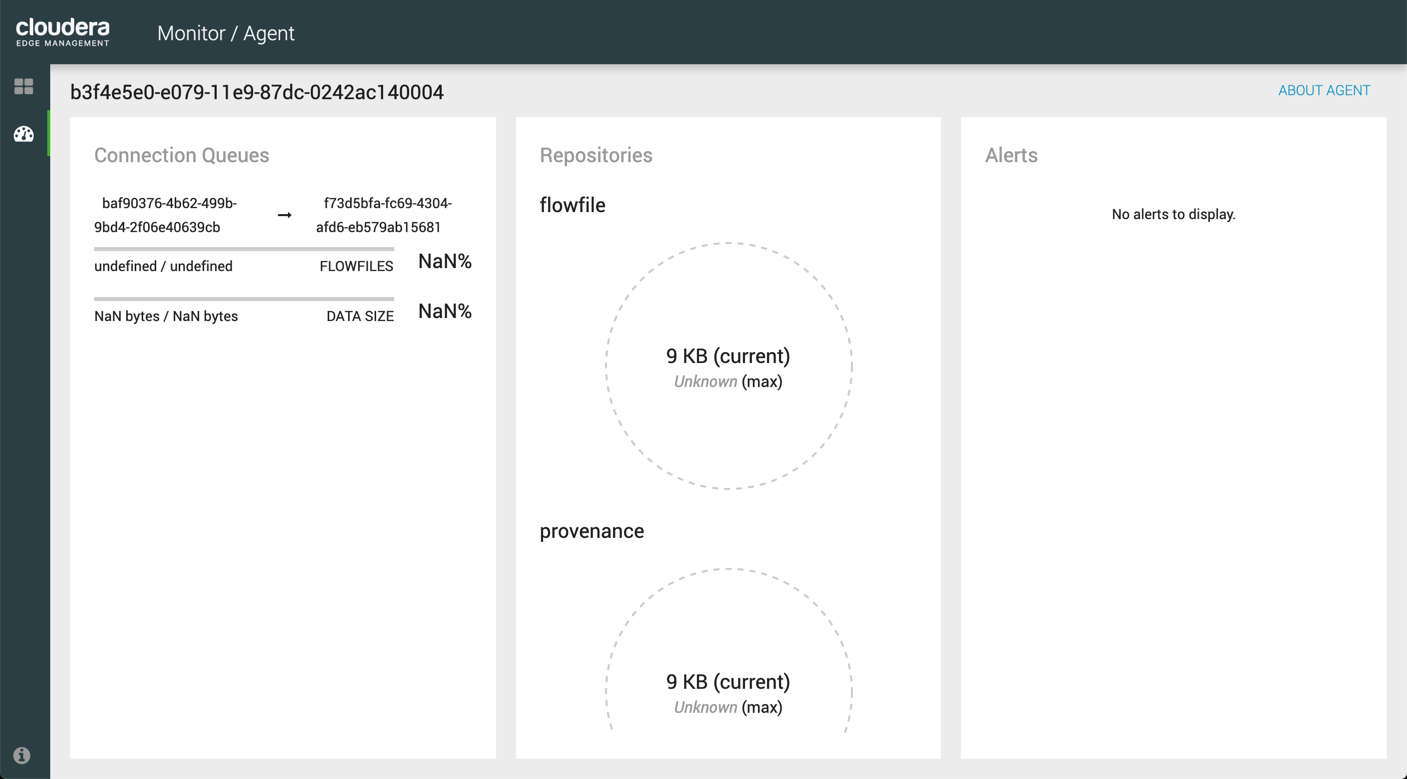
- Connection Queues. Aggregate views of all the connections throughout the instances in the agent.
- Repositories. Usage details of the repositories the agent is connected to.
- Alerts. Alerts available in the agent.
- About Agent. When you click the About Agent link, the
About
              This Agent
page appears which displays the following details about the agent of the alert:-
Last Seen
-
Location
-
Agent Class
-
Flow Name
-
Flow Version
-
Registry ID
-
Bucket Name
-
Device OS
-
Device Architecture
-
Device Memory
-
Device Cores
-
Network Device ID
-
Network Hostname
-
Network IP\u0000
-