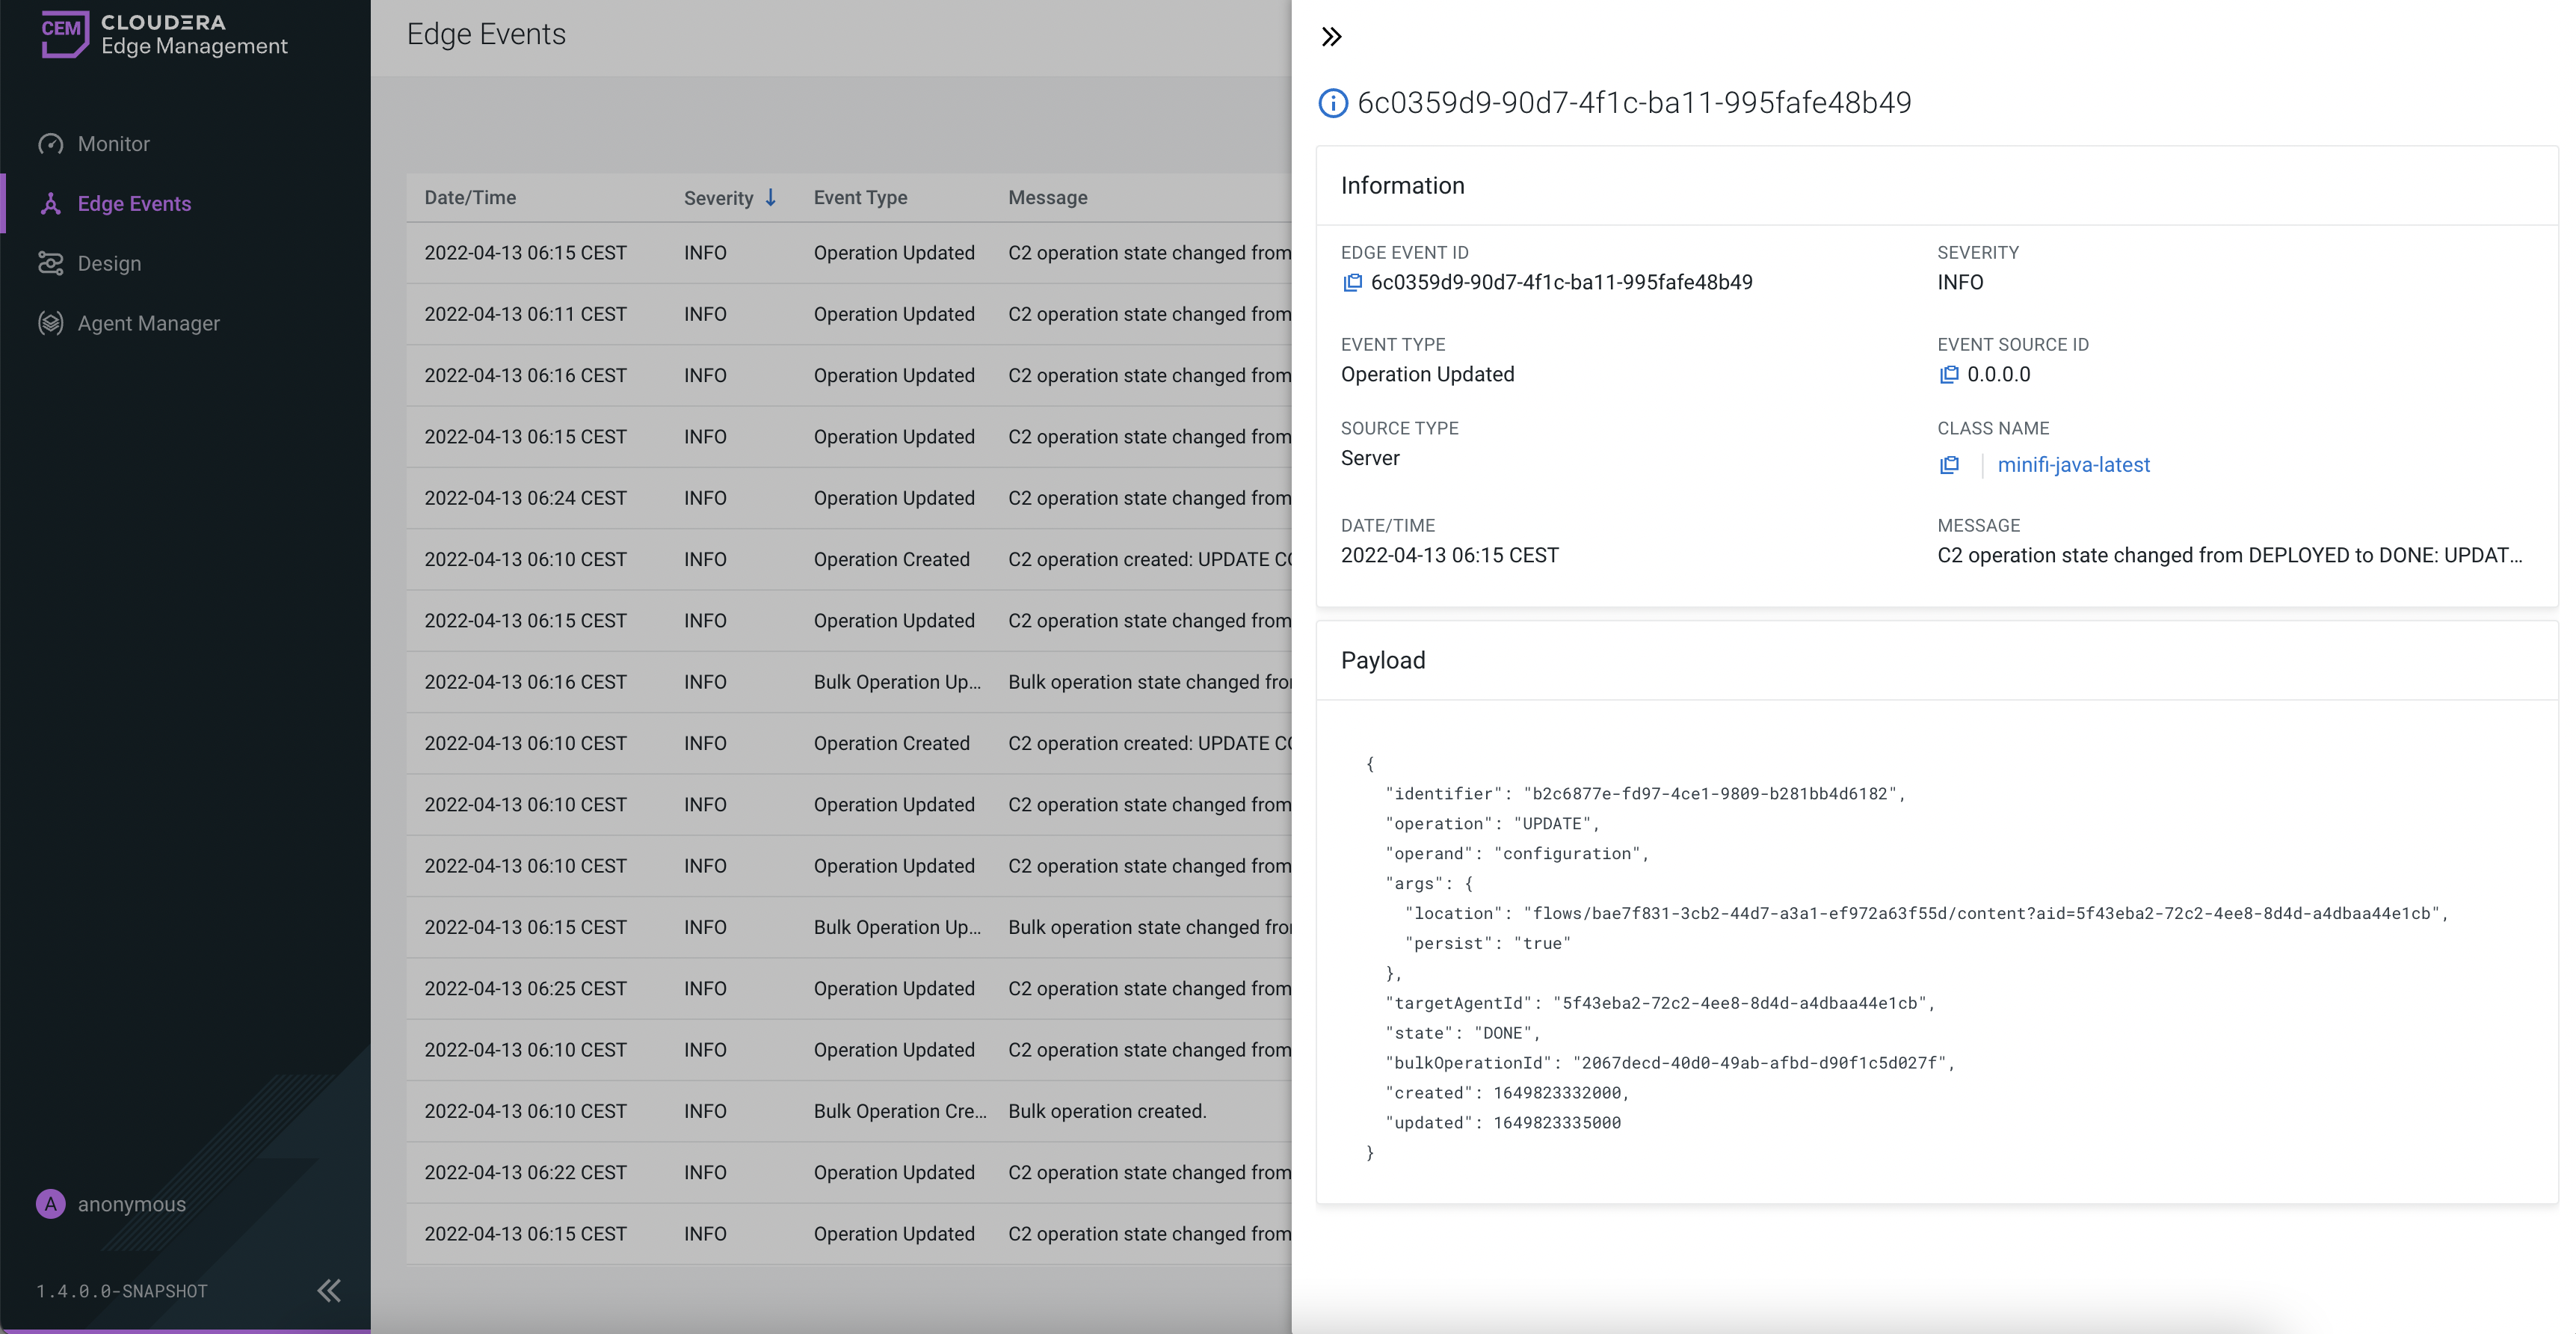
Monitoring events in CEM
Learn the options, available in the Edge Events screen, that enable you to monitor C2 server and agent events.
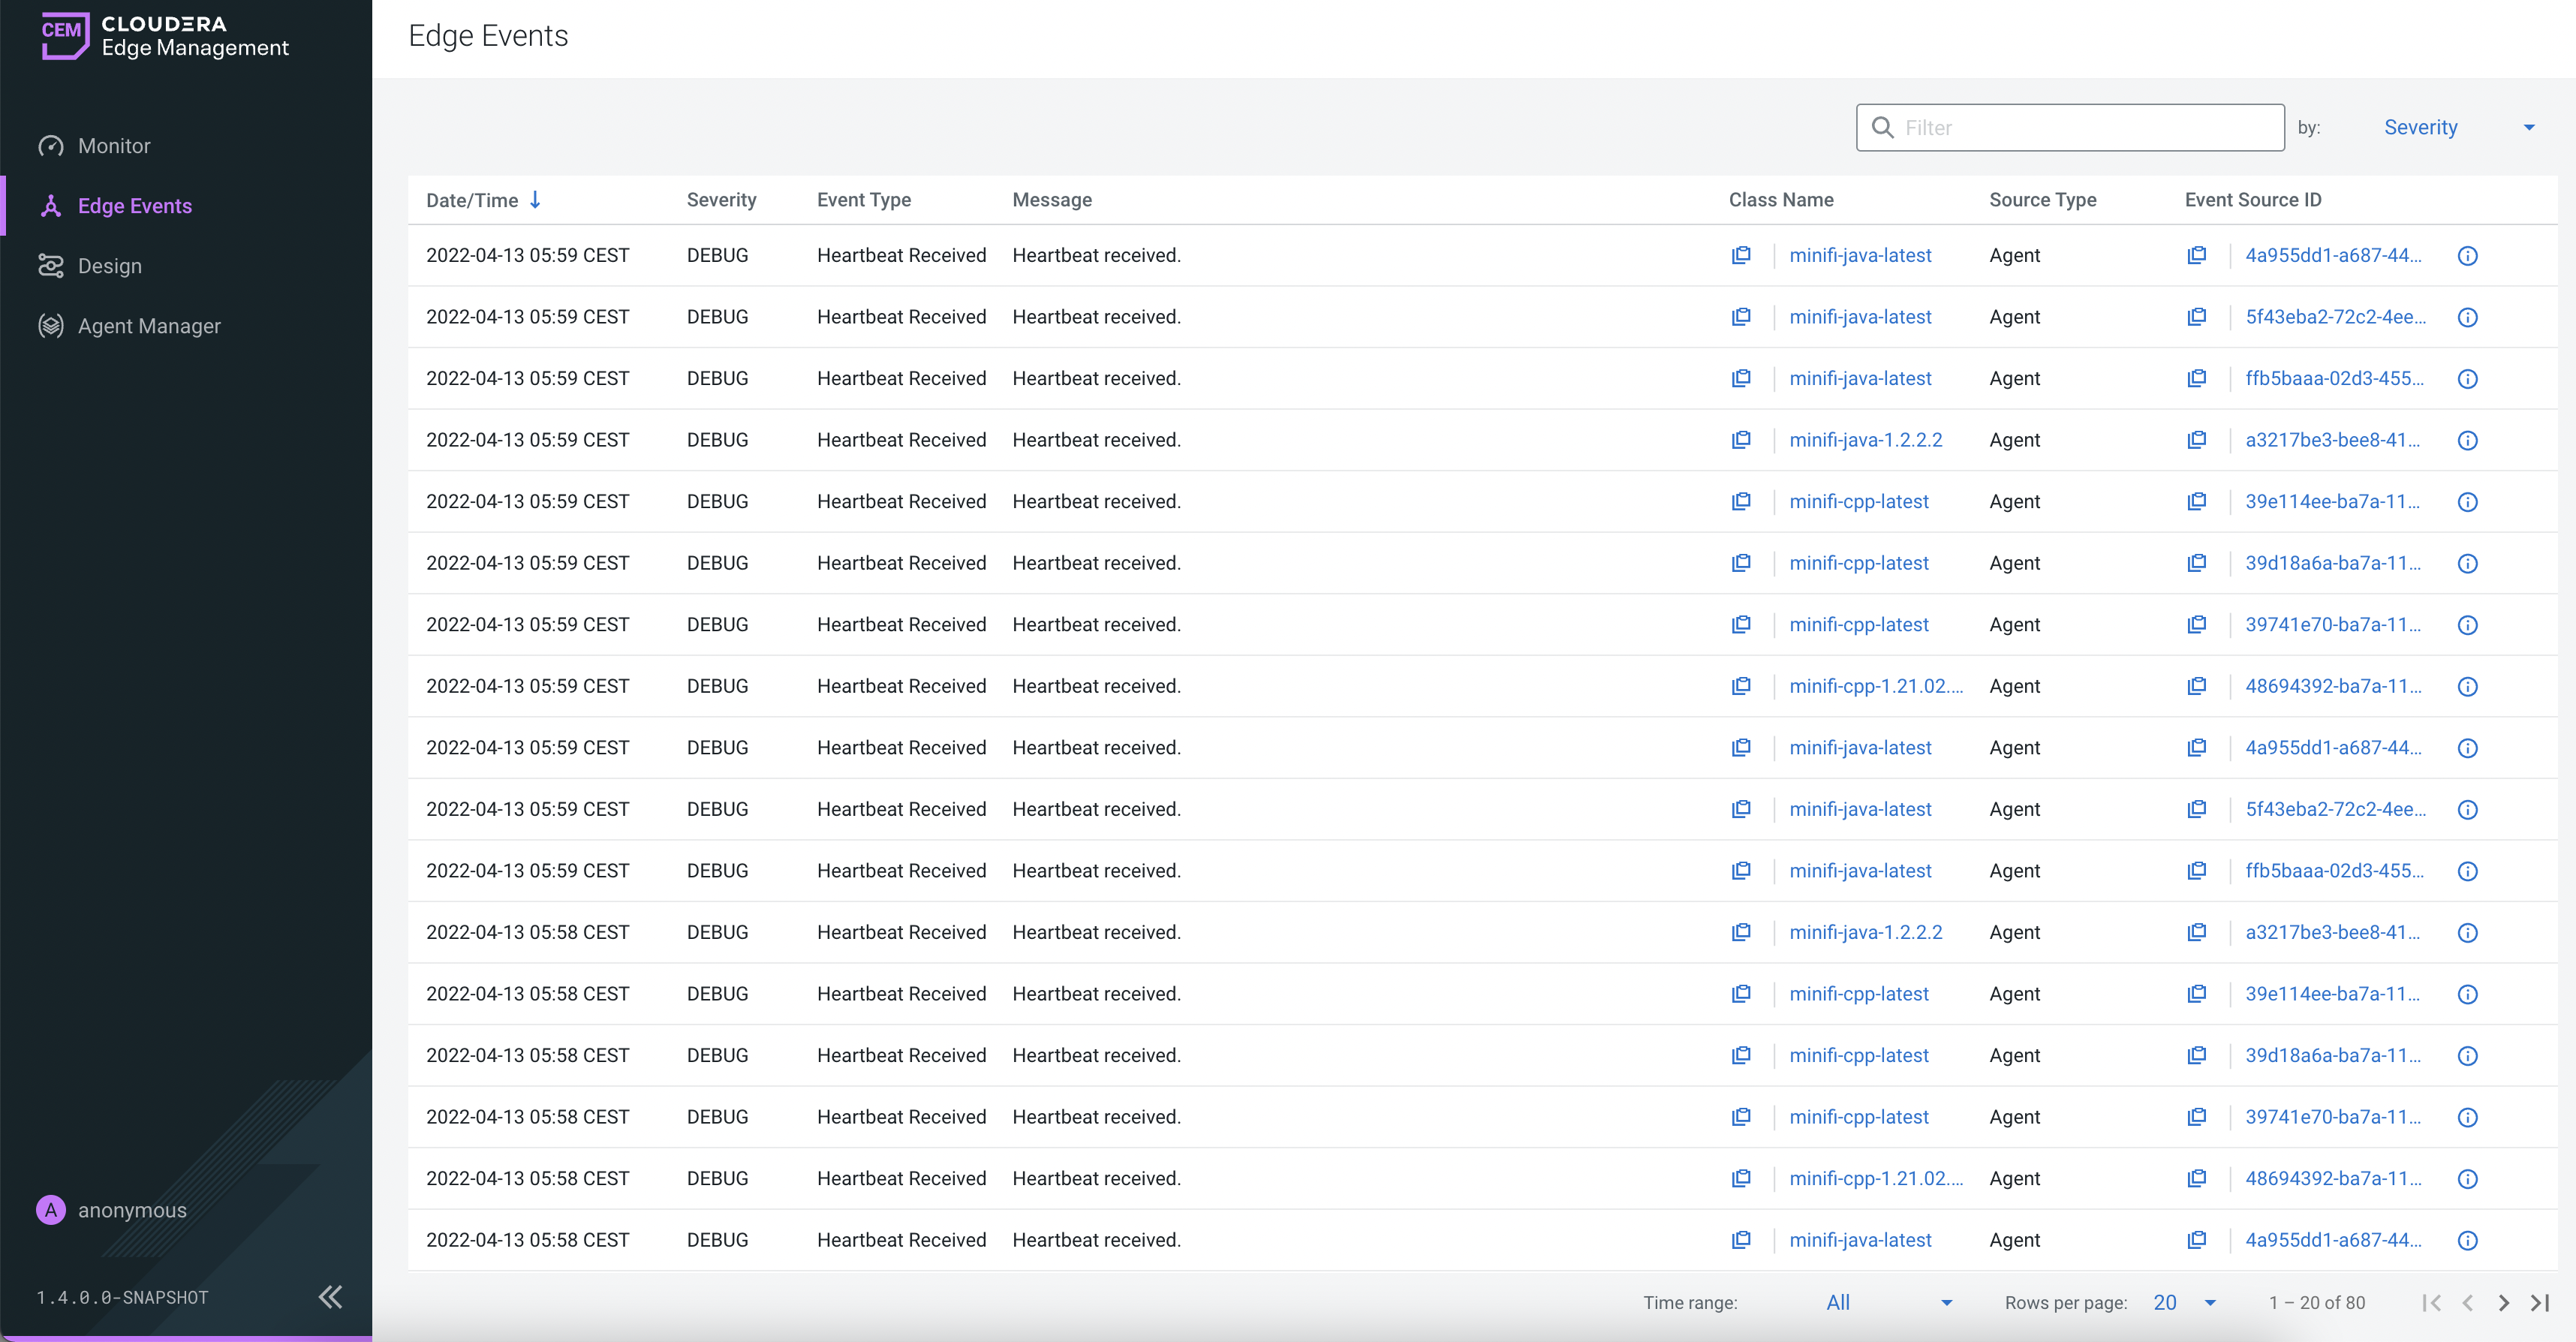
- Date/Time
- Severity
- Event Type
- Message
- Class Name
- Source Type
- Event Source ID
The Class Name and Event Source ID fields also act as links. If you click a class name link, the Metrics tab for that class appears and helps you to track details and alerts for that class, as described in the Monitoring deployments in CEM. If you click an event source ID link, the Metrics tab for that event appears and helps you to track details, alerts, commands, and configurations for that event, as described in the Managing agents in CEM.
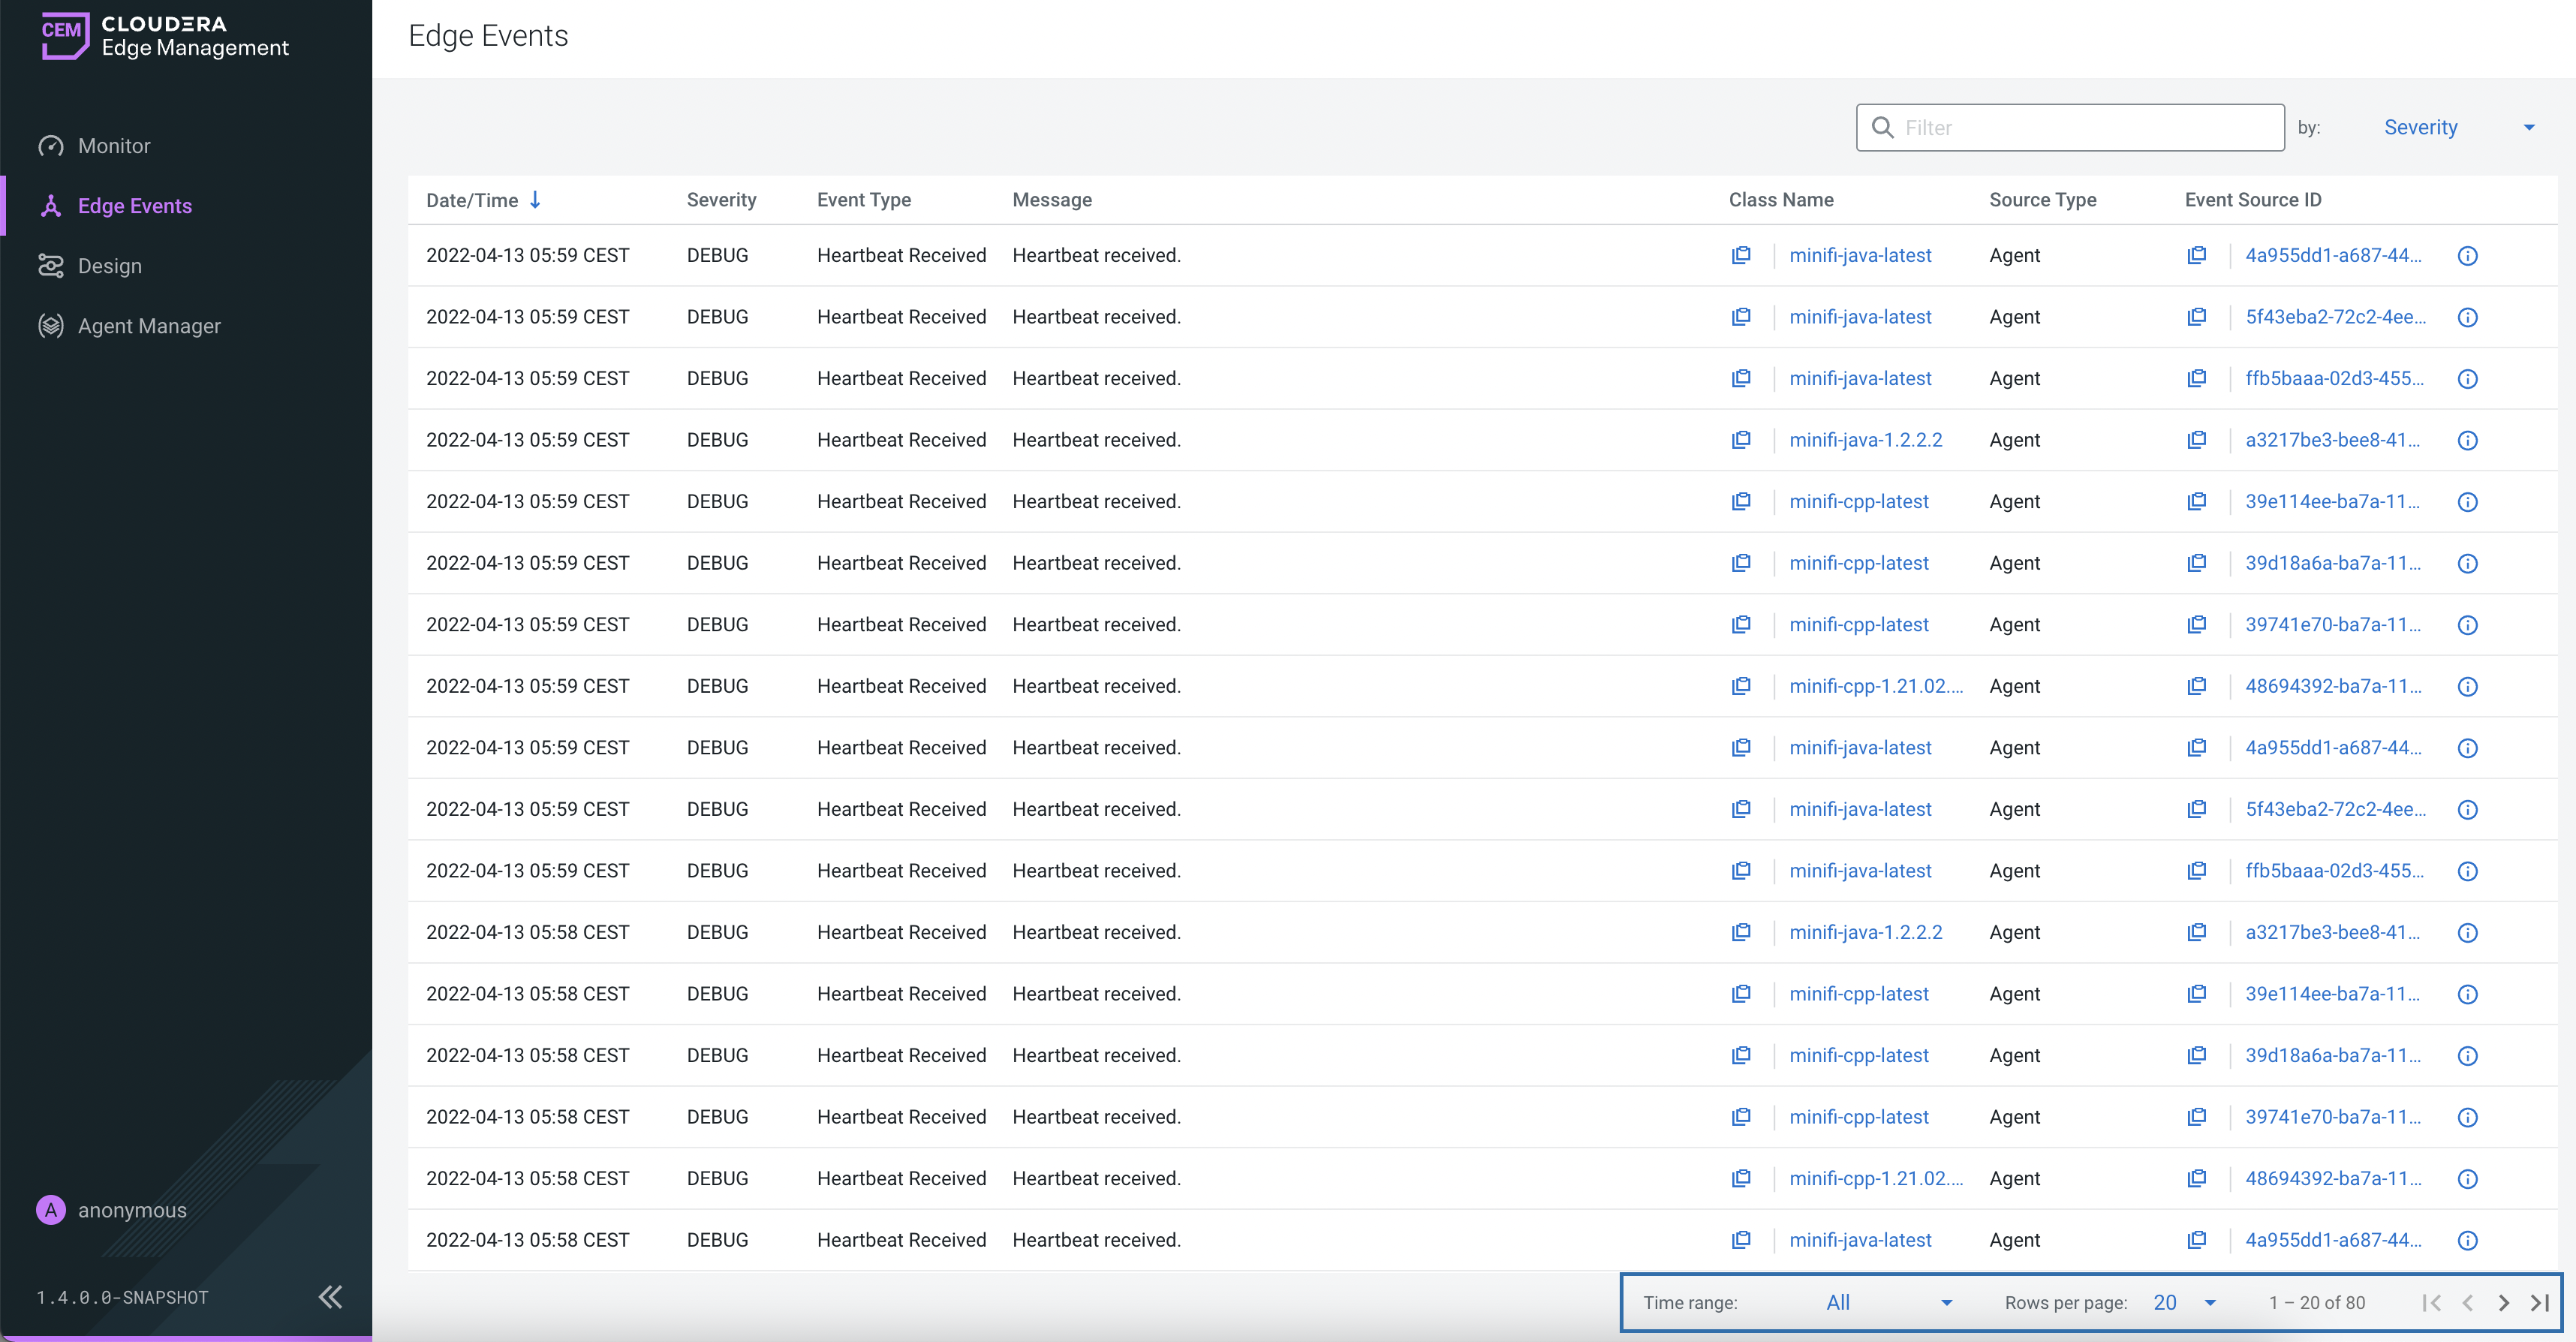
Sorting and filtering
You can sort data in each column in ascending or descending order by clicking the column name. For example, you can sort the events based on class by clicking the Class Name column.
You can also filter the events by Date/Time, Severity, Event Type, Message, Class Name,
Source Type, and Event Source ID. Select the column name in the drop-down box at the
top-right corner of the UI, enter the filter value, and select RETURN on
the keyboard to apply the filter.
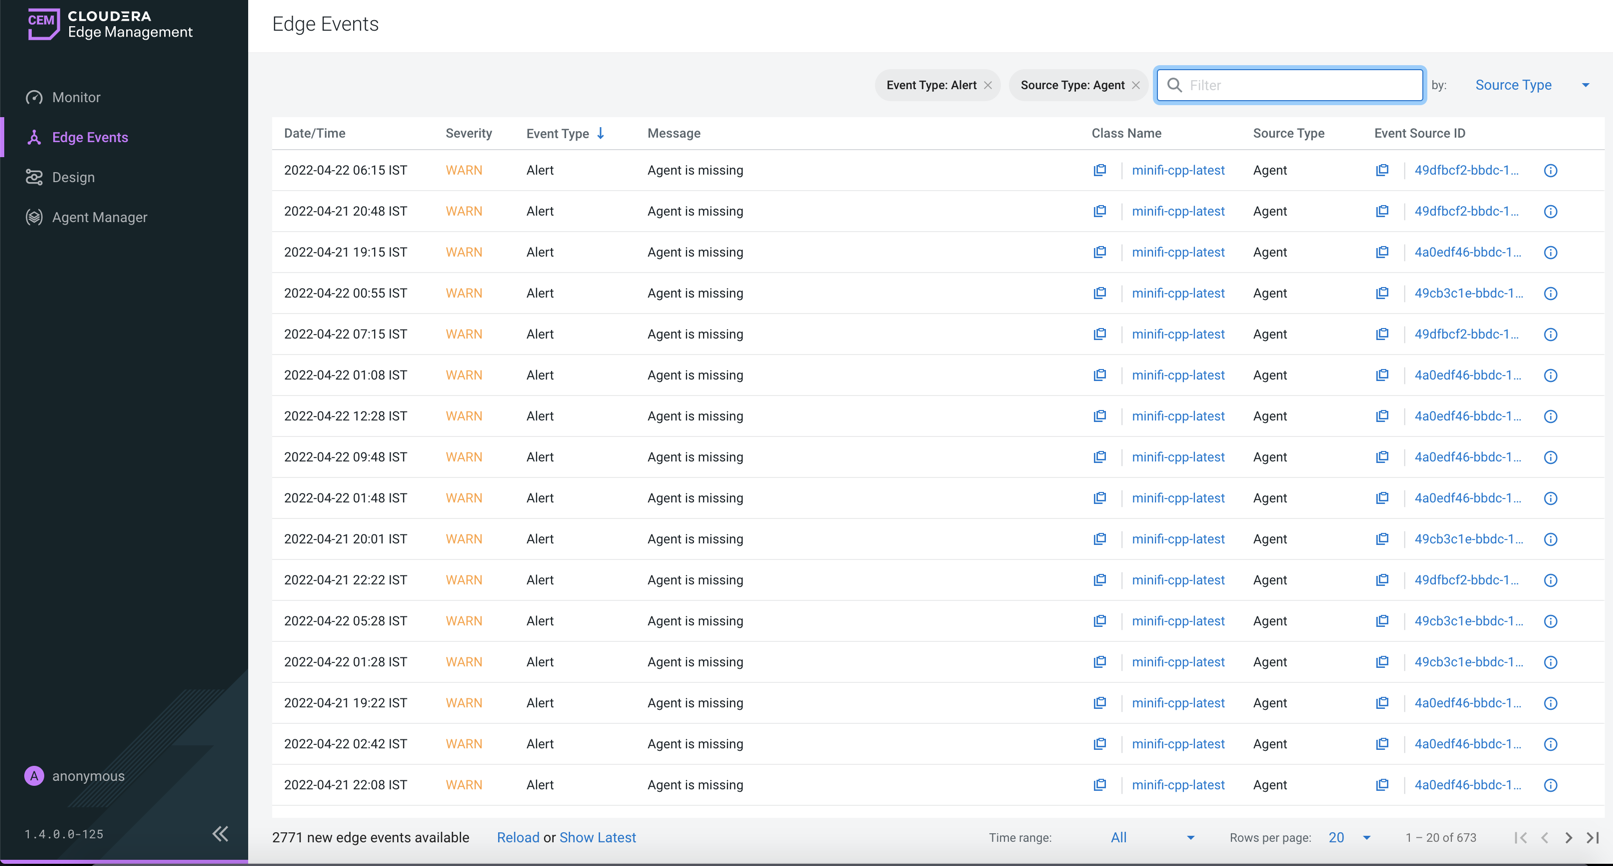
After you filter the event details as per your requirement, you can share the URL with other users who can then view your filtered event list.
Reload and show latest
You can view new events in the system by selecting either the Reload or Show Latest link which appears after you spend some time in the Edge Events page. Reload refreshes events using the existing search and sort criteria. Show Latest reloads events but sorts by the latest events using the existing search criteria.
Edge Events screen: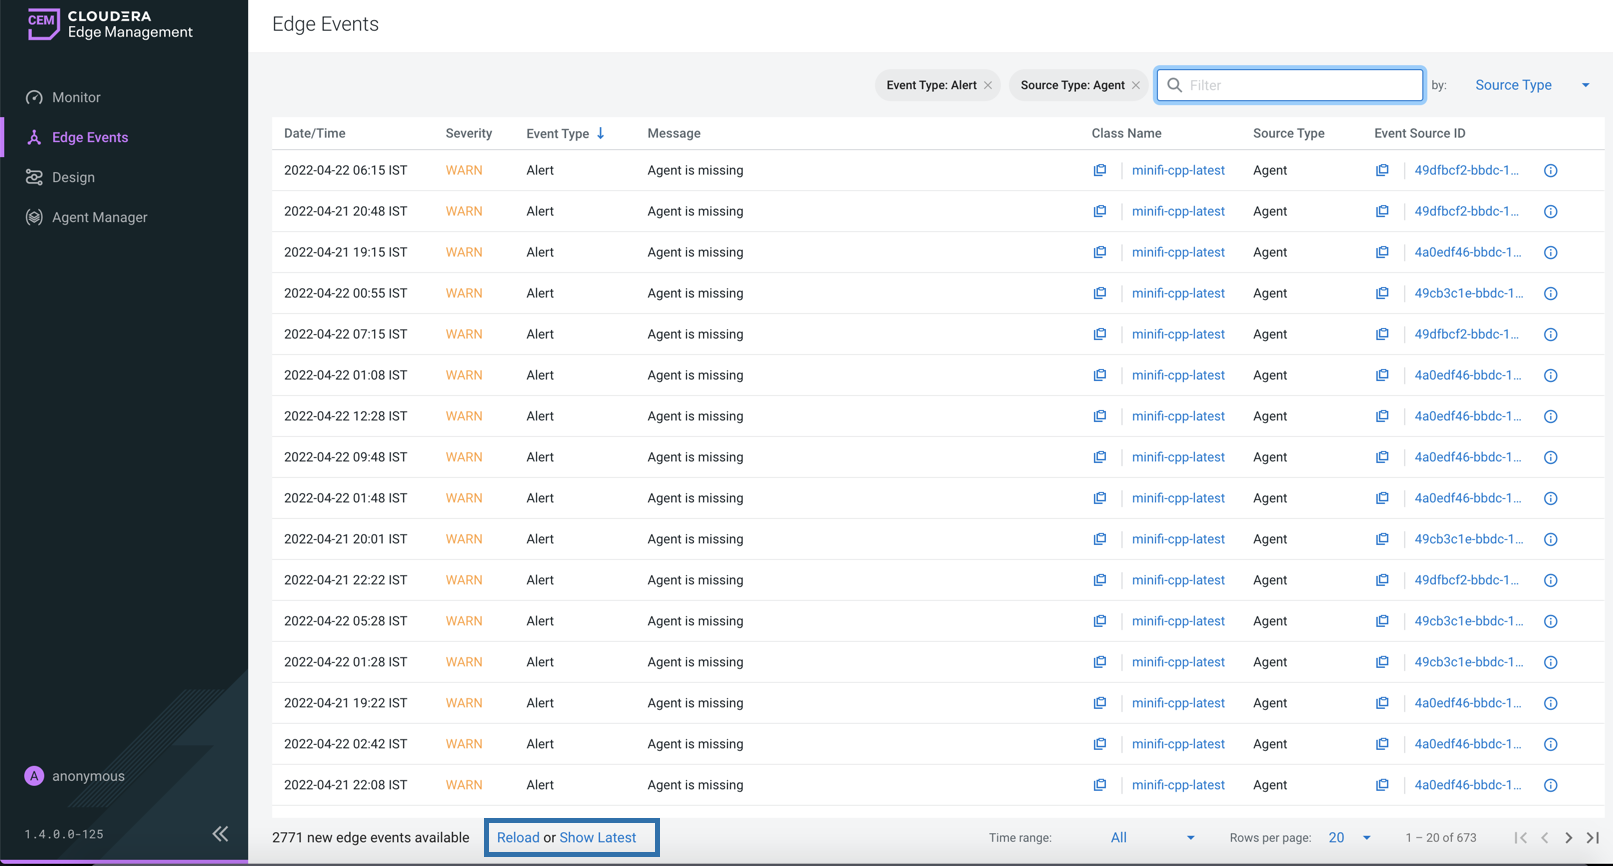
Event details
Edge Events section: