Viewing Parcel Usage
- Do one of the following:
- Click the parcel icon in the top navigation bar.
- Click Hosts in the top navigation bar and click the Parcels tab.
- Click the Parcel Usage button.
This page only shows the usage of parcels, not components that were installed as packages. If you select a cluster running packages, the cluster is not displayed, and instead you see a message indicating the cluster is not running parcels.

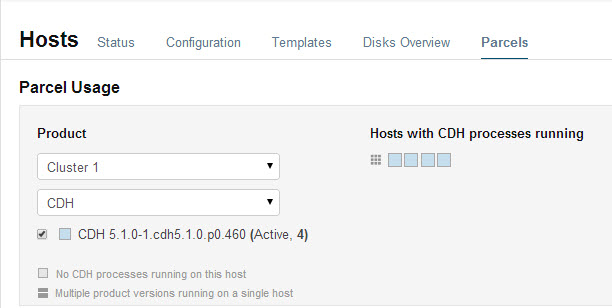
You can view parcel usage by cluster or by product.
You can also view just the hosts running only the active parcels, or just hosts running older parcels (not the currently active parcels), or both.
The host map at the right shows each host in the cluster, with the status of the parcels on that host. If the host is running the processes from the currently activated parcels, the host is indicated in blue. A black square indicates that a parcel has been activated, but that all the running processes are from an earlier version of the software. This occurs, for example, if you have not restarted a service or role after activating a new parcel. If you have individual hosts running components installed as packages, the square is empty.
Move the cursor over the grid icon to see the rack to which the hosts are assigned. Hosts on different racks are displayed in separate rows.
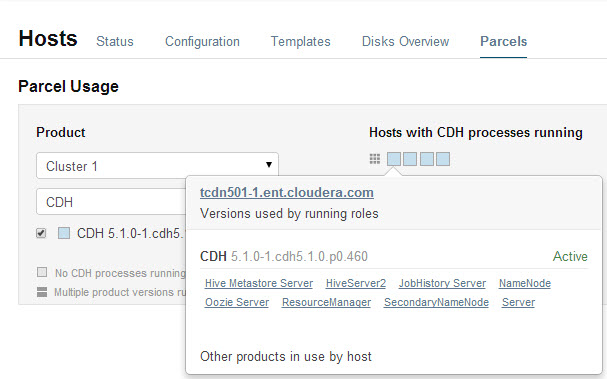
To view the exact versions of the software running on a given host, click the square representing the host. This displays the parcel versions installed on that host.

The pop-up lists the roles running on the selected host that are part of the listed parcel. Clicking a role opens the Cloudera Manager page for that role. It also shows whether the parcel is active or not.
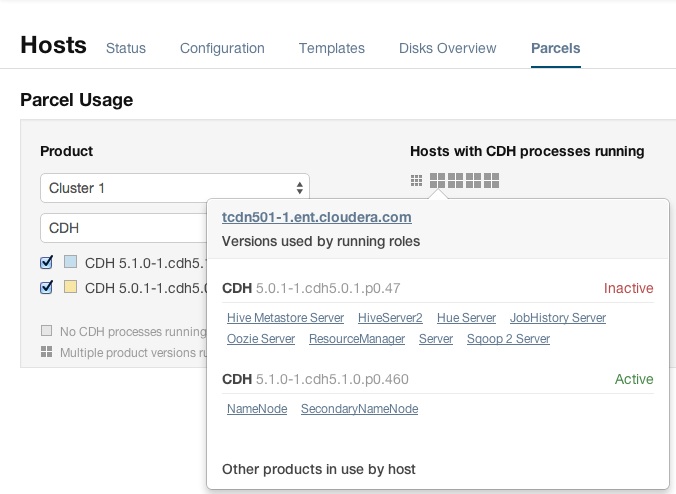
If a host is running various software versions, the square representing the host is a four-square grid icon. When you move the cursor over that host, both the active and inactive components are shown. For example, in the image below, the older CDH parcel has been deactivated, but only the HDFS service has been restarted.

