To configure memory allocations, determine how many entities are being monitored and
then consult the tables below for required and recommended memory configurations.
To determine the number of entities being monitored:
Go to Clusters > Cloudera Management
Service.
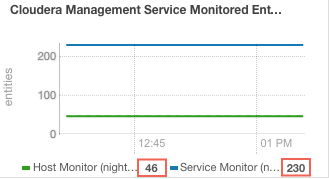
Locate the chart with the title Cloudera Management Service Monitored
Entities.
The number of monitored entities for the Host Monitor
and Service Monitor displays at the bottom of the chart. In the following example, the
Host Monitor has 46 monitored entities and the Service Monitor has 230 monitored
entities.
Use the number of monitored entities for the Host Monitor to determine its memory
requirements and recommendations in the tables below.
Use the number of monitored entities for the Service Monitor to determine its
memory requirements and recommendations in the tables below.
Clusters with
HDFS, YARN, or Impala
Use the recommendations in this table for clusters where the
only services having worker roles are HDFS, YARN, or Impala.
Number of Monitored Entities
Number of Hosts
Required Java Heap Size
Recommended Non-Java Heap Size
0-2,000
0-100
3 GB
18 GB
2,000-4,000
100-200
4.5 GB
18 GB
4,000-8,000
200-400
4.5 GB
36 GB
8,000-16,000
400-800
7.5 GB
36 GB
16,000-20,000
800-1,000
10.5 GB
36 GB
Clusters with HBase, Solr, Kafka, or Kudu
Use the
recommendations when services such as HBase, Solr, Kafka, or Kudu are deployed in the
cluster. These services typically have larger quantities of monitored
entities.
Number of Monitored Entities
Number of Hosts
Required Java Heap Size
Recommended Non-Java Heap Size
0-30,000
0-100
6 GB
36 GB
30,000-60,000
100-200
9 GB
36 GB
60,000-120,000
200-400
10.5 GB
36 GB
120,000-240,000
400-800
24 GB
60 GB
Additional tuning
Exact memory requirements on a given cluster are determined by numerous factors, and
might change over time. Following the steps on this page again from time to time, or
configuring limits higher than the recommendations herein, might become advisable (or
necessary). You might notice different symptoms regarding the operation of Service
Monitor or Host Monitor when this is the case:
The Pause Duration health test shows Concerning or
Bad status.
Monitoring performance is unsatisfactory in any way.
Logs frequently indicate pauses longer than 1000-2000 ms detected by
JvmPauseMonitor, except when the message includes no GCs
detected.
If the recommended settings do not yield satisfactory results, Cloudera recommends
using the values from the next row down until the problem is resolved. If this does not
happen even with the highest recommended values, further increase is possible with no
known limits other than the physical memory in the host. Set non-Java memory size to
100-150% of the Java heap size in this case.