Retrieving metric data
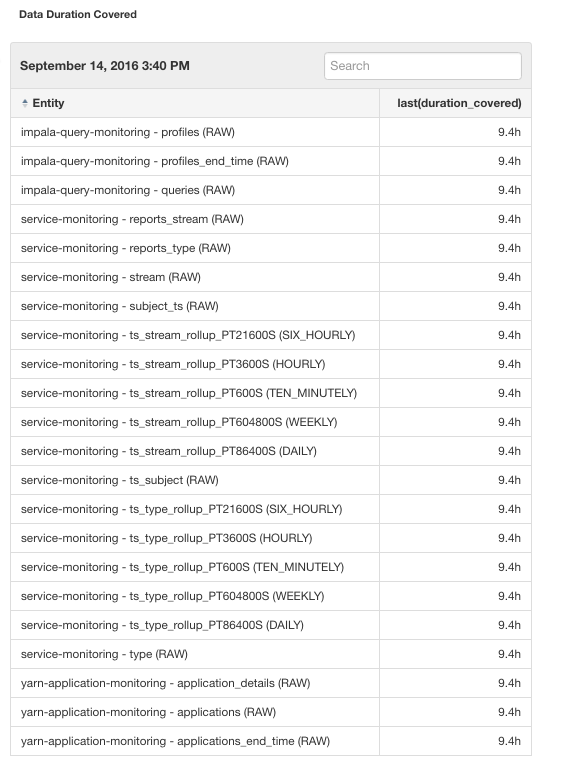
You can vire the Cloudera Manager Service Monitor data storage granularities in Cloudera Manager.
There is a Time series endpoint exposed by the Cloudera Manager REST API. The API accepts tsquery statements as input for which metrics need to be retrieved during the specified time window. The API provides functionality to specify the desired data granularity (for example, raw metric values, TEN_MINUTES, HOURLY etc.). Each granularity level of data is maintained in a leveldb table. This data is aggregated from raw metric values such as minimum, maximum, etc. within the corresponding data window.
For example, if you do not need the metric data at a specific timestamp but care more about the hourly usage, HOURLY data should be good enough. In general, the longer the granular window it is, the less storage it is taking, and thus the longer period of time you are able to keep that level of data without being purged when the storage raches the configured limit. In the case of Cloudera Manager Cluster Utilization Reports, Cloudera Manager generates the reports based on an hourly window.

To configure the Time series storage used by the Service Monitor, go to and search for "Time-Series Storage".
