Displaying Chart Details
You can interact with a chart to display various chart details.
When you move your mouse over a chart, its background turns gray, indicating that you can act upon it.
- Moving the mouse to a data point on a line, stack area, or bar chart shows the details about that data point in a pop-up tooltip.
-
Click a line, stack area, scatter, or bar
chart to expand it into a full-page view with a legend for the
individual charted entities as well more fine-grained axes
divisions.
- If there are multiple entities in the chart, you can
- Check and uncheck the legend item to hide or show the
time series for the entities on the chart.

- If there are service, role, or host instances in the
chart, click the
 View link to display the instance's Status page.
- Check and uncheck the legend item to hide or show the
time series for the entities on the chart.
- Click the Close button to return to the regular chart view.
- If there are multiple entities in the chart, you can
- Heatmap - Clicking a square in a heatmap displays a line chart of the time series for that entity.
-
Histogram -
- Mousing over the upper right corner of a
histogram and clicking
 opens a pop-up containing the query that generated the chart, an
expanded view of the chart, a list of entity names and links to the
entities whose metrics are represented by the histogram bars, and
the value of the metric for each entity. For example, clicking the
following histogram
opens a pop-up containing the query that generated the chart, an
expanded view of the chart, a list of entity names and links to the
entities whose metrics are represented by the histogram bars, and
the value of the metric for each entity. For example, clicking the
following histogram 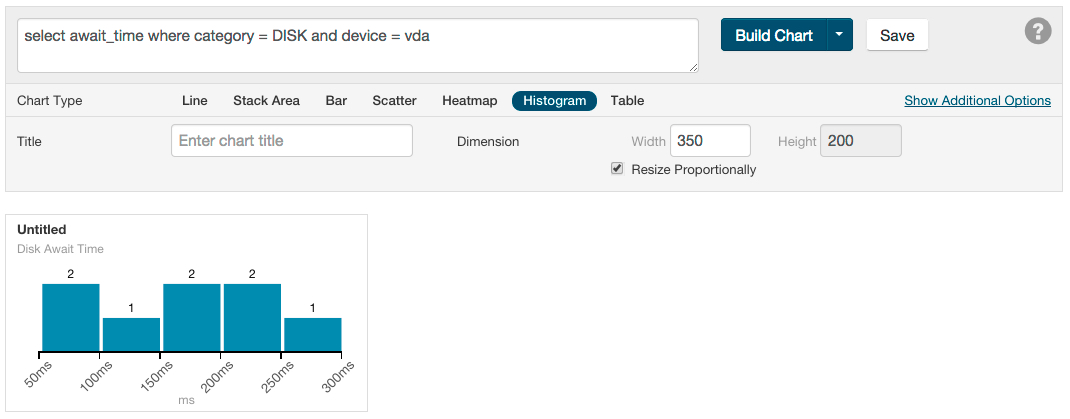
displays the following: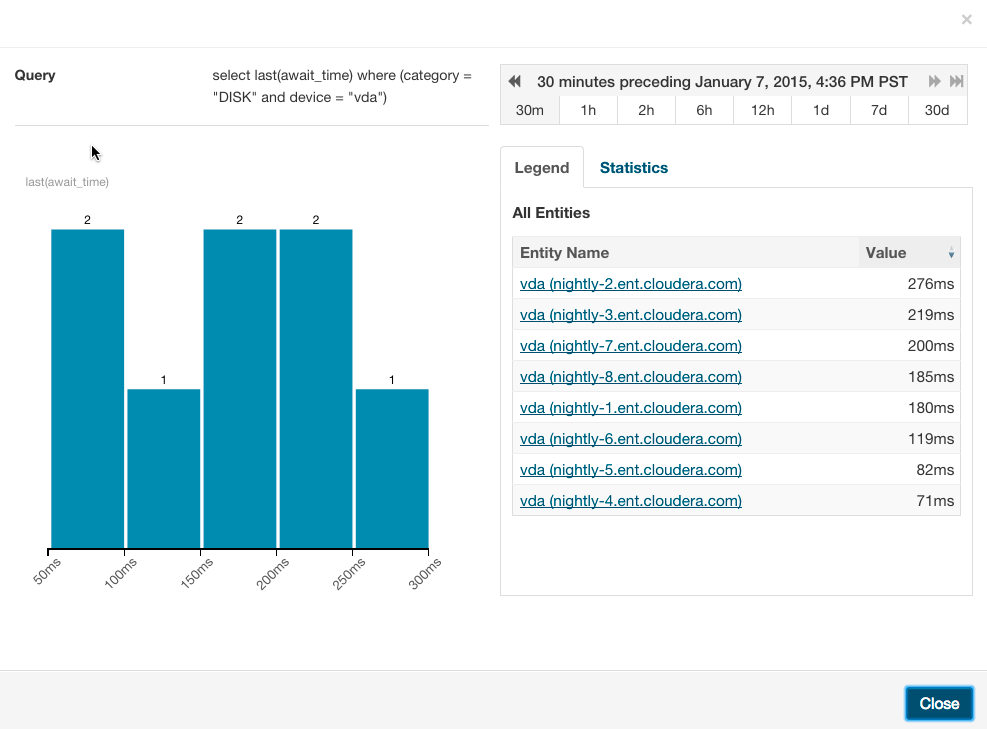
- Clicking a bar in the expanded histogram
displays a line chart of the time series from which the histogram
was generated:
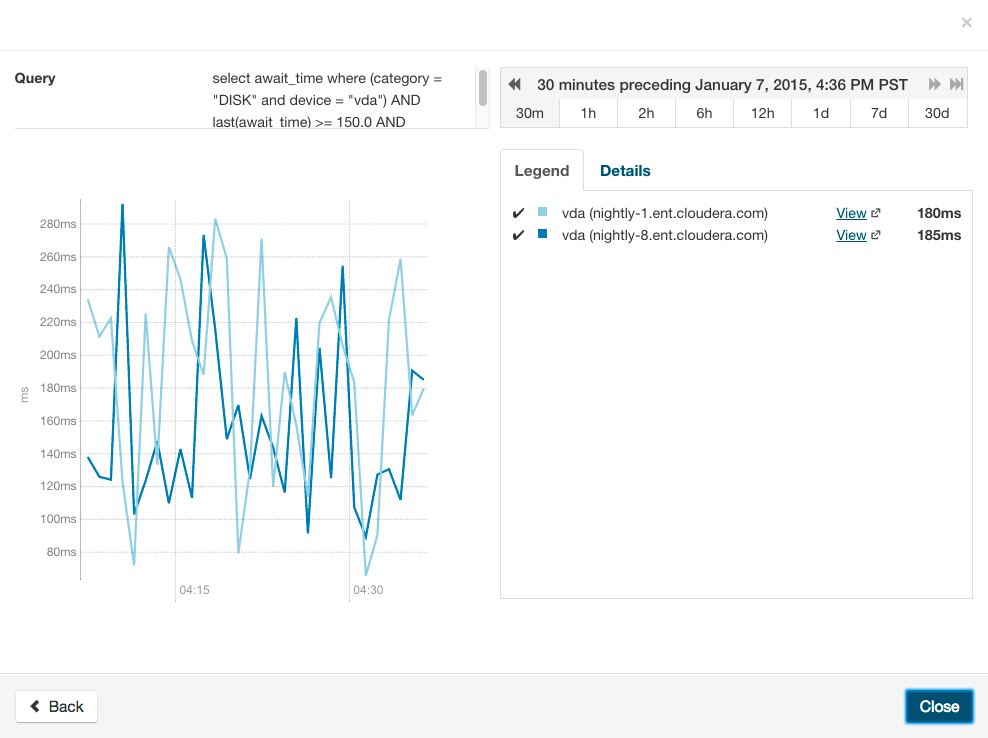
Clicking the < Back link at the bottom left of the line chart returns to the expanded histogram.
- Mousing over the upper right corner of a
histogram and clicking