Managing and monitoring Hive ACID table replication policies
Manage and monitor the replication policies to run, disable, delete, configure, or view replication job history.
- You create a database that contains one managed table, two external tables,
three virtual views, and four materialized
views.
create database sample3; use sample3; CREATE TABLE table_04 (id int, name string); CREATE EXTERNAL TABLE table_02 (id int, name string); CREATE EXTERNAL TABLE table_03 (id int, name string); #Create virtual views (these cause the mismatch) CREATE VIEW view_01 AS SELECT * FROM table_04; CREATE VIEW view_02 AS SELECT * FROM table_04; CREATE VIEW view_03 AS SELECT * FROM table_04; CREATE materialized VIEW mv1 AS SELECT * FROM table_04; CREATE materialized VIEW mv2 AS SELECT * FROM table_04; CREATE materialized VIEW mv3 AS SELECT * FROM table_04; CREATE materialized VIEW mv4 AS SELECT * FROM table_04; - You create and run a Hive ACID replication policy on the sample3 database.
- After the replication policy run is complete, the
Tables column on the Replication
Policies page displays the following statistics for the
replication policy:
- The SOURCE displays the DUMP operation details
in the following ways:
- The numerator is the sum total of all the managed tables,
external tables, and virtual views. In this example, the
numerator is 1 + 2 + 3 =
6.
This statistic does not include the materialized view because the hive.repl.dump.include.materialized.views advanced configuration snippet is set to false by default.
- The denominator is the sum total of all the managed tables, external tables, virtual views, and materialized views. In this example, the denominator is 1 + 2 + 3 + 4 = 10.
- The numerator is the sum total of all the managed tables,
external tables, and virtual views. In this example, the
numerator is 1 + 2 + 3 =
6.
- The TARGET displays the LOAD operation details
the following ways:
- The numerator is the number of Hive ACID tables (managed tables). In this example, the numerator is 1.
- The denominator is the number of subdirectories created in the staging location. Subdirectories are created for Hive ACID tables (managed tables) and virtual views. Therefore, in this example, the denominator is 1 + 3 = 4.
- The SOURCE displays the DUMP operation details
in the following ways:
Incremental job run details for Hive ACID replication policy
Starting from Cloudera Manager 7.13.2 SP1, you can monitor the incremental job run details for Hive ACID replication policies on the Replication Policies page.
When you create a Hive ACID replication policy, you can choose to run it immediately after the creation process is complete or run it on a schedule. The first replication policy job run is a bootstrap run during which Replication Manager replicates all the existing data from the source cluster to the target cluster. Subsequent runs are incremental job runs. During an incremental job run, only the changed data (delta data) between the previous and current runs is replicated.
When a replication policy job run is initiated, the DUMP and LOAD operations are triggered simultaneously. However, whether both the operations are run during the same run depends on the duration of the DUMP operation:
-
Fast DUMP Operations: If the DUMP operation completes within a few seconds, the LOAD operation initiates within the same run.
-
Extended DUMP Operations: If the DUMP operation runs for several minutes, the LOAD operation has no data ready to load and is skipped. When the next replication job triggers, the process skips the DUMP operation because the target cluster has not yet loaded the previous DUMP output. The LOAD operation then continues loading the prepared DUMP data into the target cluster.
Understanding replication cards
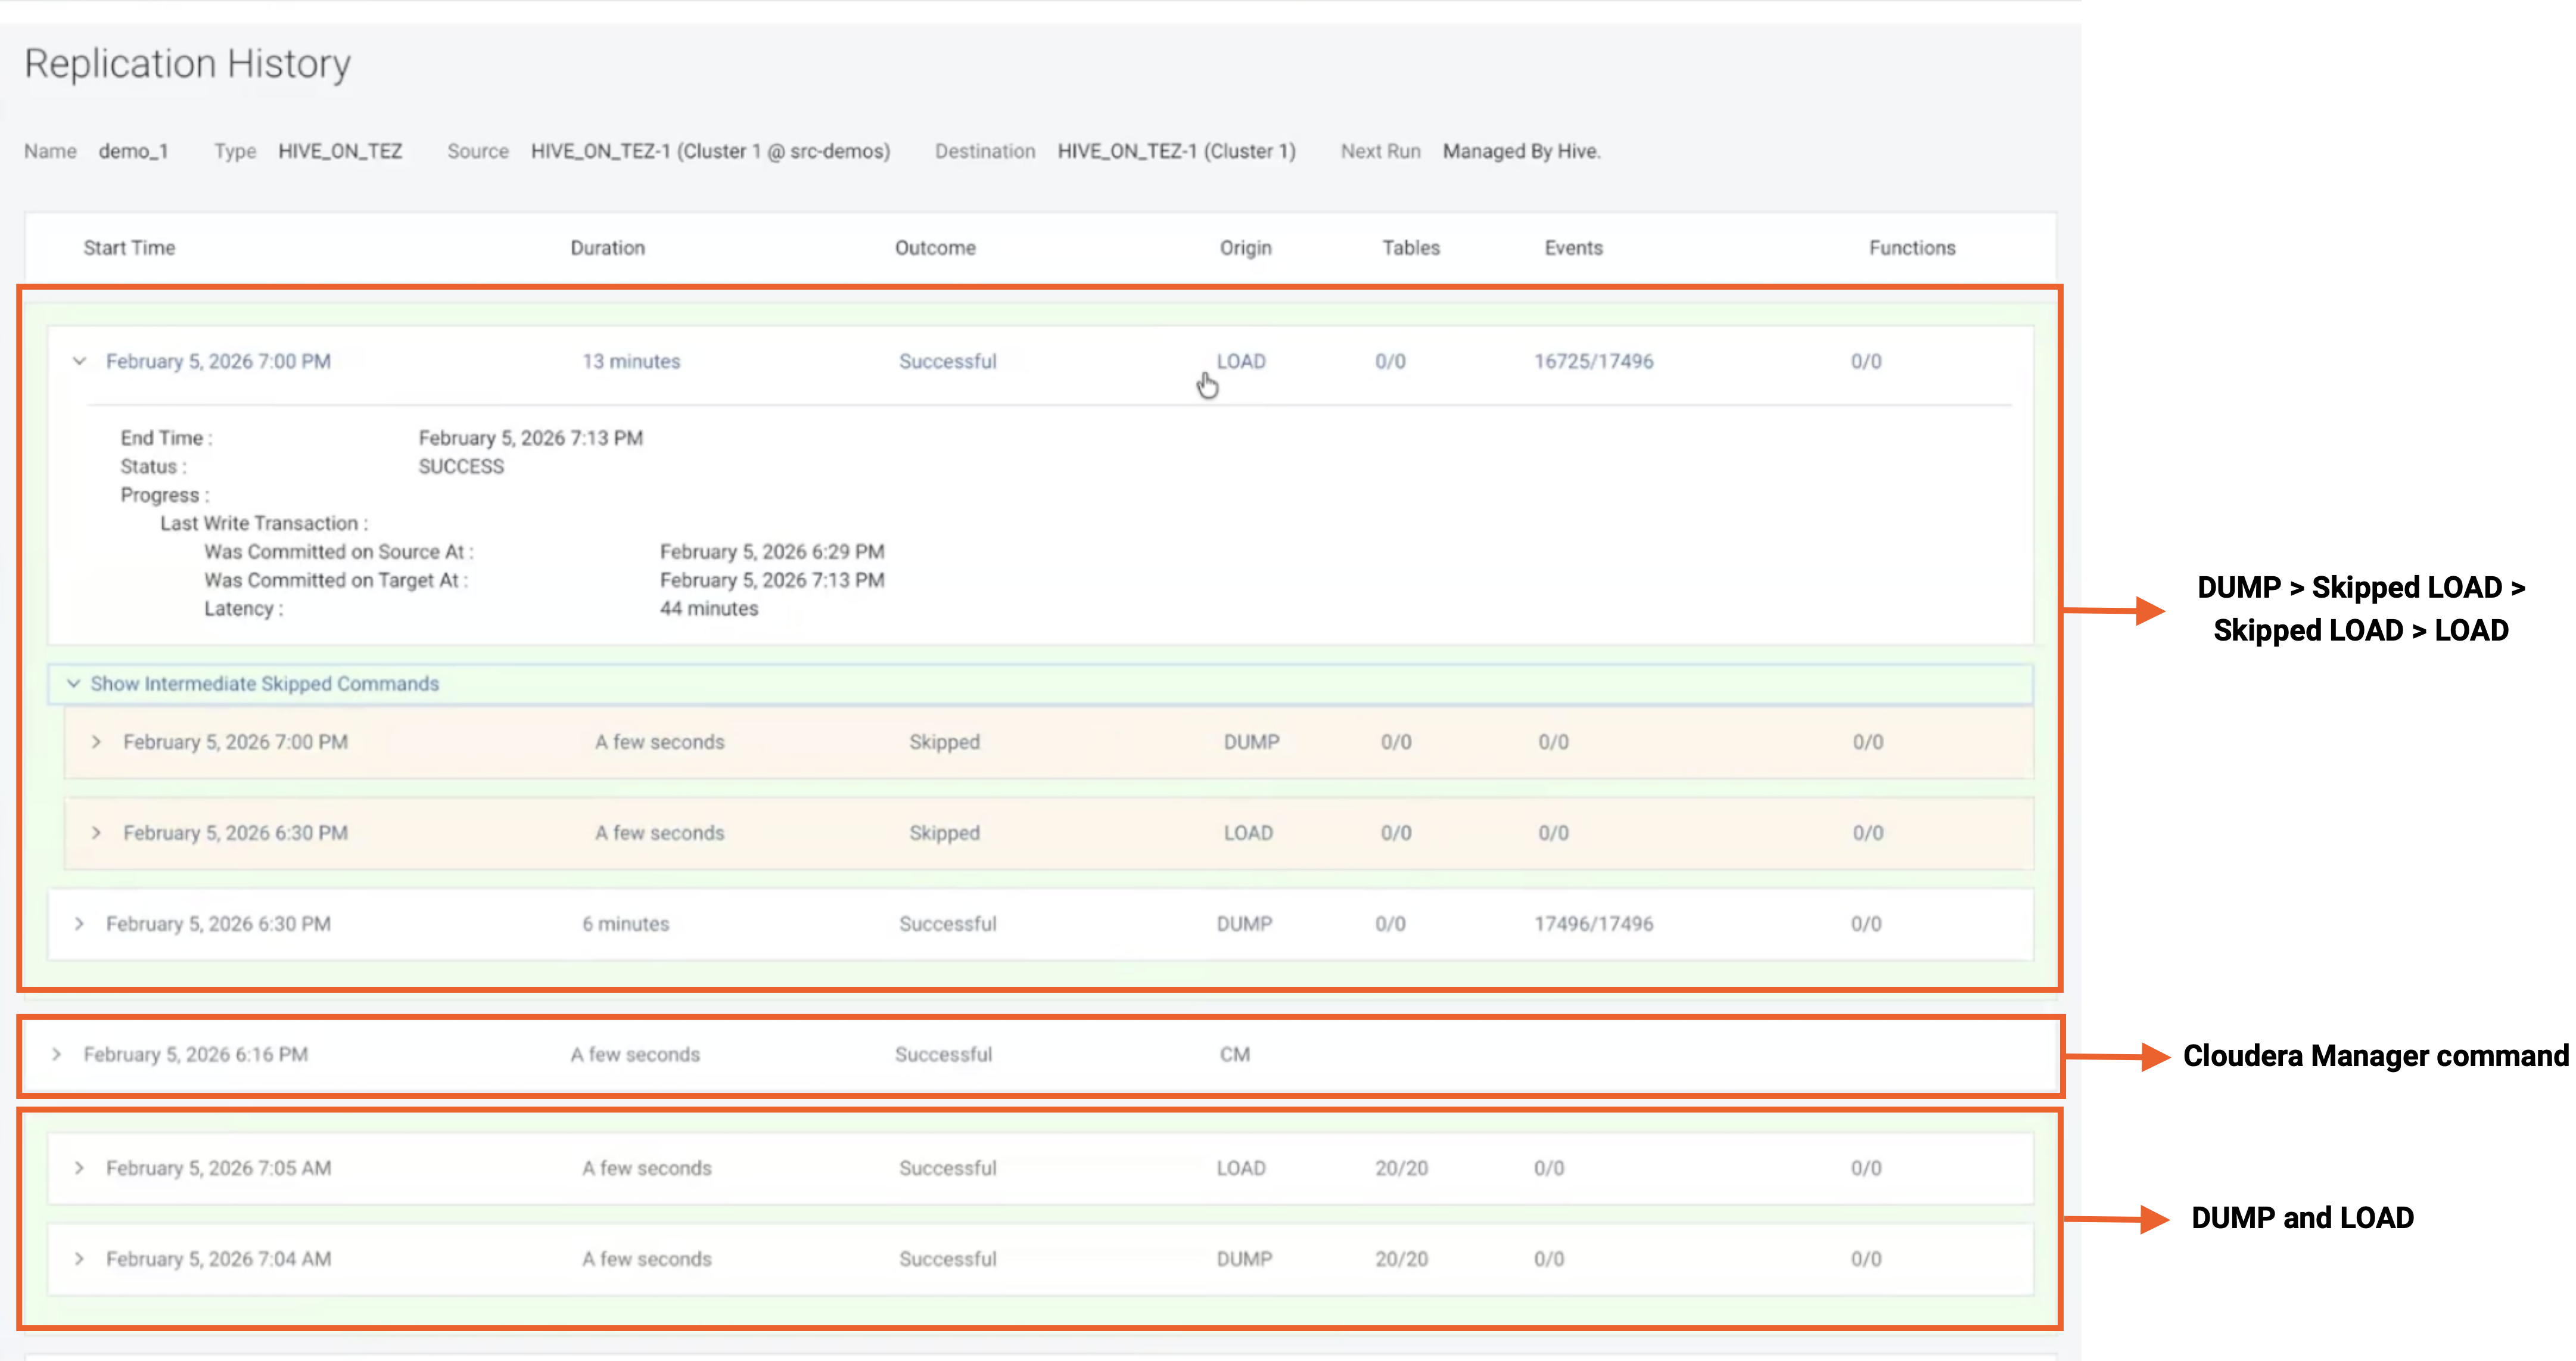
A complete replication cycle consists of a DUMP phase and a successful LOAD phase. The Replication History page consolidates this cycle into a single replication card. The UI displays this replication card as soon as Replication Manager starts the LOAD operation corresponding to a DUMP operation. A green replication card indicates a successful replication cycle, while a red replication card indicates a failed replication cycle.
For standard Cloudera Manager commands, the replication card displays CM in the ORIGIN field. For orphan replication history items, the ORIGIN field displays DUMP, running on the Source or LOAD, running on the target. These orphan replication items do not belong to any consolidated replication cycle.
The replication process supports the following three cycle patterns:
- Direct DUMP and LOAD Operation
DUMP and LOAD operations run independently:
-
If a skipped LOAD starts after the DUMP begins, Replication Manager includes that LOAD in the unified replication cycle.
-
If a skipped LOAD starts before the DUMP begins, it creates an orphan skipped LOAD (showing DUMP, running on the Source in the ORIGIN field), followed by a complete replication cycle ().
Understanding the replication cycle
The replication cycle consists of the following phases:
DUMP phase. During this phase, Replication Manager performs the following actions:- Initiates the DUMP operation on the source cluster.
- Scans the Hive metastore (HMS) events for the required database.
- Captures a replay of all data modifications (including INSERT, UPDATE, or DELETE write transactions) since the previous job run. Replay refers to the sequence of write transactions that occurred on the source cluster which would be replayed or executed in the same order on the target cluster during the LOAD operation.
- Runs the REPL DUMP command to extract the captured metadata and structural state. This command dumps the output configuration and transaction replay logs into a shared staging directory. You can configure the staging directory during the replication policy creation process using the Destination Staging Path option.
LOAD phase. During this phase, Replication Manager performs the following actions:- Initiates the LOAD operation on the target cluster.
- Mirrors the exported data from the staging area onto the target database by executing or "replaying" the sequence of captured source write transactions in the exact same order on the target cluster. Replay ensures absolute consistency and data synchronization.
- Runs the REPL LOAD command to import the metadata records into the target HMS and starts data copy tasks (often leveraging parallel DistCp jobs) to write the actual underlying data files directly to the target storage root from the staging location.
Monitoring incremental replication job run progress
Starting from Cloudera Manager 7.13.2 SP1, when you expand a LOAD operation for an incremental job run on the Replication History page, the interface displays the End Time of the replication job run, current Status, and a real-time Progress section.
| Metric | Description |
|---|---|
| Last Write Transaction | Displays the latest replay of write transactions on the target cluster. During incremental replication, the job run replays all the source events sequentially from the DUMP operation, including write transactions such as INSERT, UPDATE, or DELETE commands. |
| Was Committed on Source At | Displays the precise timestamp when the latest write transaction (currently replaying on the target cluster) was originally committed on the source cluster. This indicates point-in-time catch-up consistency. For example, if this field displays "January 19, 2026, 9:26 A.M.", the target database is in the exact state the source database was at that specific time. |
| Was Committed on Target At | Displays the timestamp when that same write transaction finished executing and was committed on the target cluster. |
| Latency | Displays how far behind (in time) the target cluster is compared to the source cluster. This metric decreases as the replication run proceeds and catches up. Administrators can track this precise replication lag to verify that it aligns with their Recovery Point Objectives (RPOs). |