Presentation of Aggregate Data
Aggregate data points returned from the Cloudera Manager API appear as shown in this section.
A cross-time aggregate:
{
        "timestamp" : "2014-02-24T00:00:00.000Z",
        "value" : 0.014541698027508003,
        "type" : "SAMPLE",
        "aggregateStatistics" : {
          "sampleTime" : "2014-02-23T23:59:35.000Z",
          "sampleValue" : 0.0,
          "count" : 360,
          "min" : 0.0,
          "minTime" : "2014-02-23T18:00:35.000Z",
          "max" : 2.9516129032258065,
          "maxTime" : "2014-02-23T19:37:36.000Z",
          "mean" : 0.014541698027508003,
          "stdDev" : 0.17041289765265377
        }
      }
A raw cross-entity aggregate:
{
        "timestamp" : "2014-03-26T00:50:15.725Z",
        "value" : 3288.0,
        "type" : "SAMPLE",
        "aggregateStatistics" : {
          "sampleTime" : "2014-03-26T00:49:19.000Z",
          "sampleValue" : 7232.0,
          "count" : 4,
          "min" : 1600.0,
          "minTime" : "2014-03-26T00:49:42.000Z",
          "max" : 7232.0,
          "maxTime" : "2014-03-26T00:49:19.000Z",
          "mean" : 3288.0,
          "stdDev" : 2656.7549127961856,
          "crossEntityMetadata" : {
            "maxEntityDisplayName" : "cleroy-9-1.ent.cloudera.com",
            "minEntityDisplayName" : "cleroy-9-4.ent.cloudera.com",
            "numEntities" : 4.0
          }
        }
      }
A cross-time, cross-entity aggregate:
{
"timestamp" : "2014-03-11T00:00:00.000Z",
"value" : 3220.818863879957,
"type" : "SAMPLE",
"aggregateStatistics" : {
"sampleTime" : "2014-03-10T22:28:48.000Z",
"sampleValue" : 7200.0,
"count" : 933,
"min" : 1536.0,
"minTime" : "2014-03-10T21:02:17.000Z",
"max" : 7200.0,
"maxTime" : "2014-03-10T22:28:48.000Z",
"mean" : 3220.818863879957,
"stdDev" : 2188.6143063503378,
"crossEntityMetadata" : {
"maxEntityDisplayName" : "cleroy-9-1.ent.cloudera.com",
"minEntityDisplayName" : "cleroy-9-4.ent.cloudera.com",
"numEntities" : 3.9787037037037036
}
}
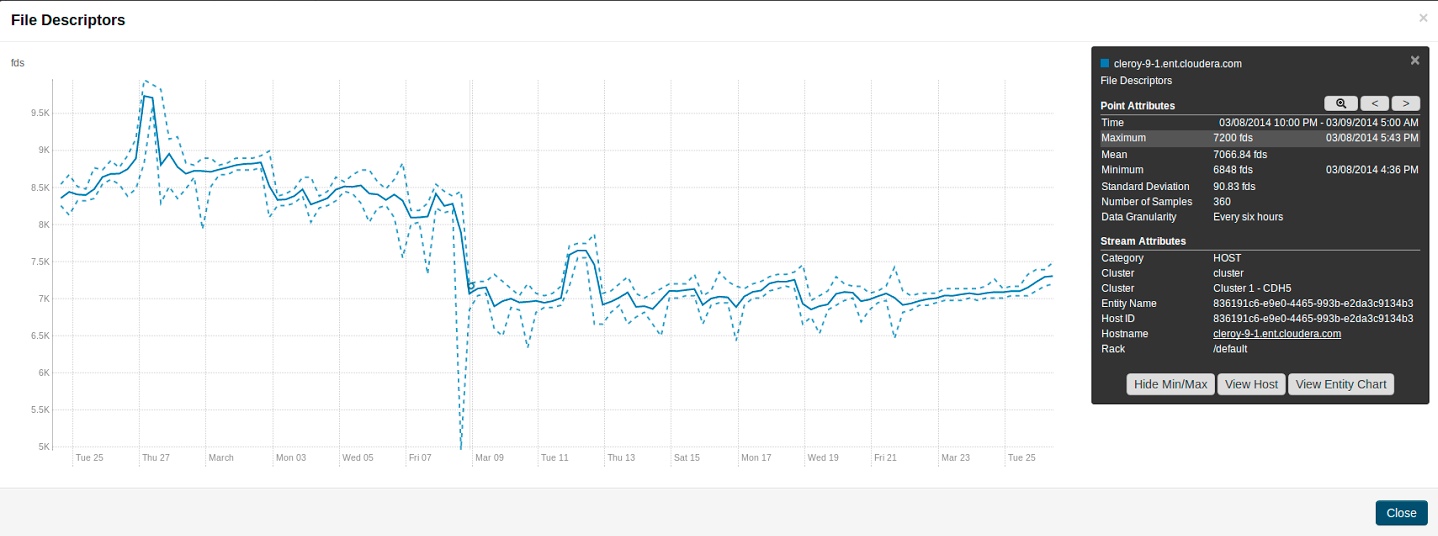
}These differ from non-aggregate data points by having the aggregateStatistics structure. Note that the value field in the point structure will always be the same as the aggregteStatistics mean field. The Cloudera Manager UI presents aggregate statistics in a number of ways. First, aggregate statistics are made available in the hover detail and chart popover when dealing with aggregate data. Second, it is possible to turn on and turn off the display of minimum and maximum time-series streams in line charts of aggregate data. These streams are displayed using dotted lines and give a visual indication of the underlying metric values data range over the time considered, entities considered or both. These lines are displayed by default for single stream line charts of aggregate data. For all line charts this behavior can be turned on and turned off using the chart popover.