Time Line
The Time Line allows you to view status and health information for a specific point in time or across a range of time. The Time Line appears on many pages in Cloudera Manager.
When you view the top level service and Hosts tabs, the Time Line shows status and health only for a specific point in time. When you are viewing the Logs and Events tabs, and when you are viewing the Status, Commands, Audits, Jobs, Applications, and Queries pages of individual services, roles, and hosts, the Time Line appears as a Time Range Selector, which lets you highlight a range of time over which to view historical data.
Click the
( ) icon at the far right to turn on and turn off the display of the
Time Line.
) icon at the far right to turn on and turn off the display of the
Time Line.
Cloudera Manager displays timestamped data using the time zone of the host where Cloudera Manager server is running. The time zone information can be found under the menu.
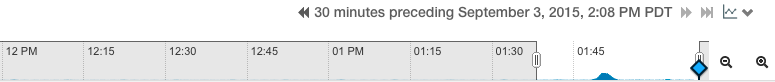
The background chart in the Time Line shows the percentage of CPU utilization on all hosts in the cluster, updated at approximately one-minute intervals, depending on the total visible time range. You can use this graph to identify periods of activity that may be of interest.
The Reports screen () does not support the Time Range Selector: the historical reports accessed from the Reports screen have their own time range selection mechanism.
Use the Zoom In and Zoom Out buttons ( and
and  ) to zoom the time line graph in or out.
- Zoom In shows a shorter time period with more detailed interval segments. Zooming does not change your selected time range. However, the ability to zoom the Time Line can make it easier to use the selector to highlight a time range.
- Zoom Out lets you show a longer time period on the time range graph (with correspondingly less granular segmentation).