Creating a Trigger for CPU Capacity
This trigger fires whenever the CPU percentage exceeds 90%. However, just exceeding 90% of available CPU resources is not necessarily a bad thing. What would be of more concern is if CPU resources were to consistently exceed 90% over an extended period. You can modify the trigger to evaluate the average CPU usage over time.
To modify the trigger to capture high CPU usage in a five minute window, do the following.
- In Cloudera Manager, go to the Hosts page.
- Click a link in the Name column to open the host status page.
- In the Health Tests section, click the Show n Good link.
- Click the link for CPU Capacity.
- Choose .
The metric expression function for average over time,
moving_avg, is not available from the pop-up menu in the editor. You can edit the expression directly using tsquery language. - Above the Expression editor, click Edit manually.
- Revise the expression as follows.
IF (select cpu_percent where entityName=$HOSTID and min(moving_avg(cpu_percent, 300) ) > 90)
      DO health:concerning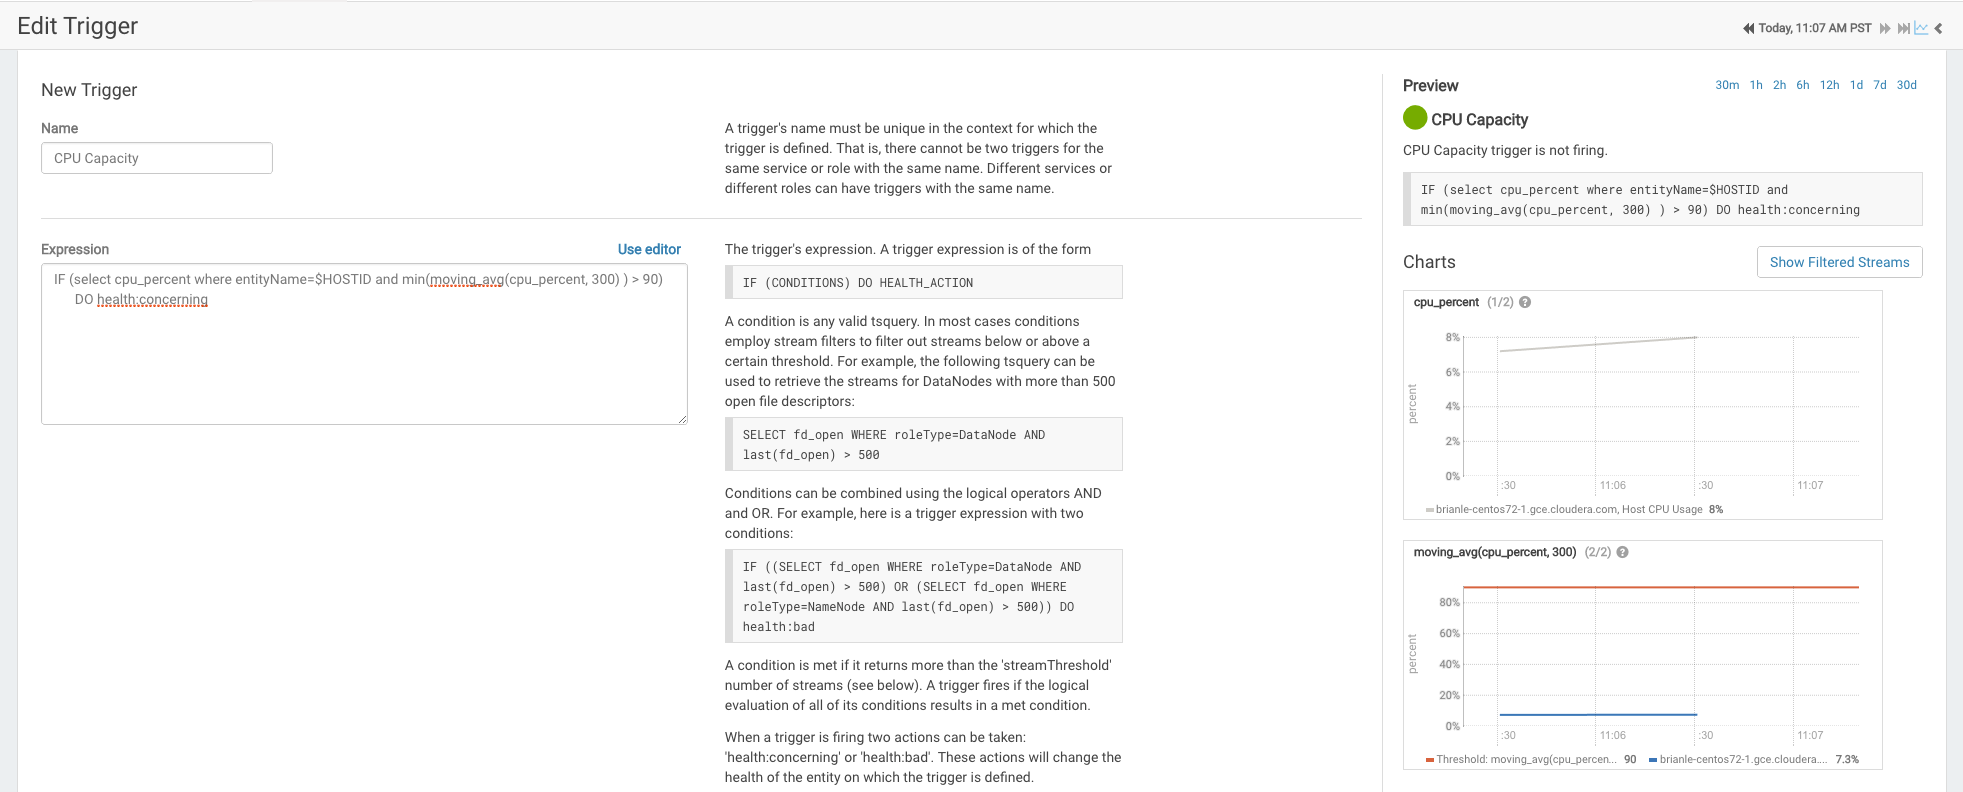
- Click Save Trigger.