You can monitor your SQL Stream jobs using the Streaming SQL Console and the Flink
Dashboard.
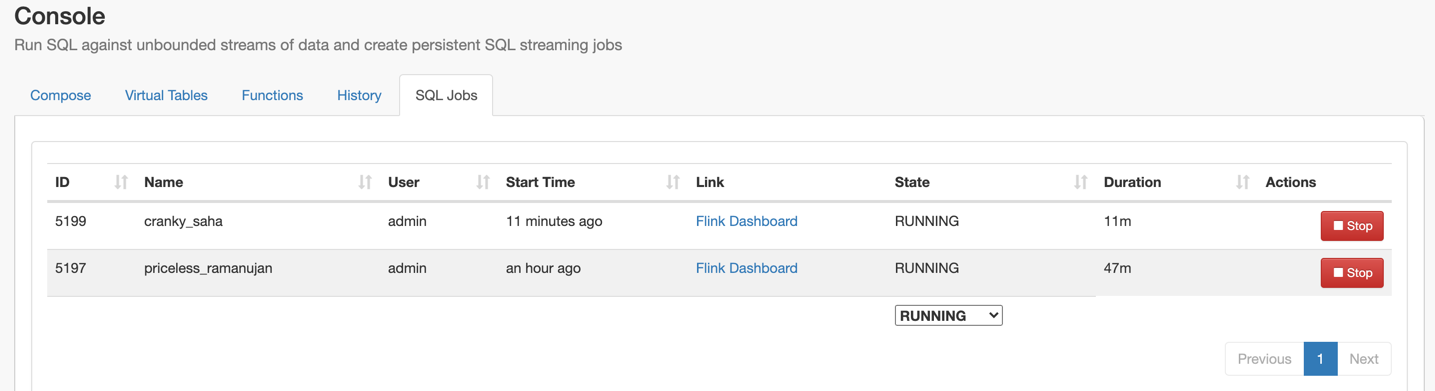
Using the Streaming SQL Console
To monitor your jobs with Streaming SQL Console:
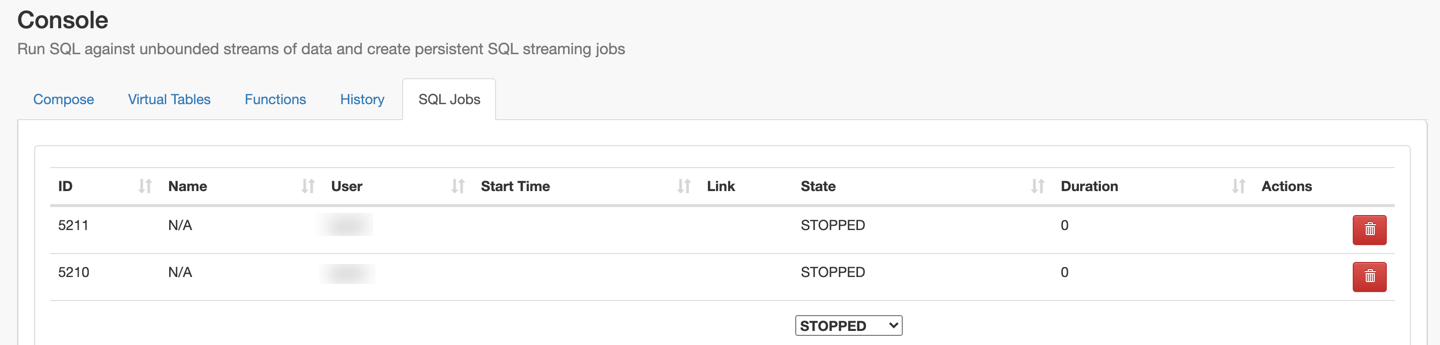
Click on Console on the main menu.
Click on the SQL Jobs tab, and choose a State.
You can choose
between Running, Stopped, Cancelled and Failed state.
Select the job you would like to monitor.
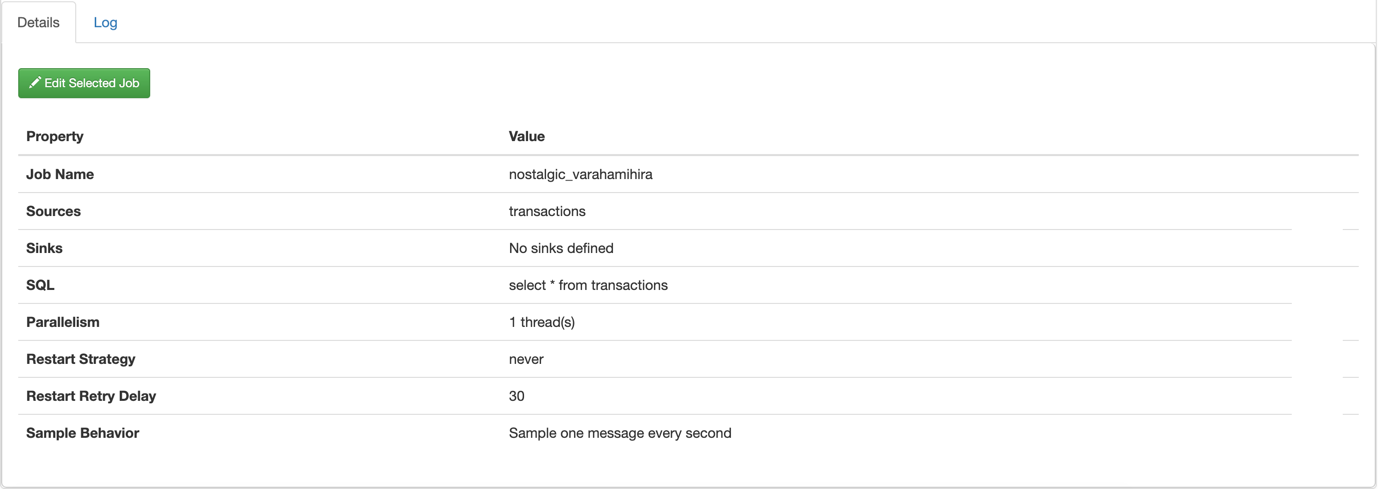
Select the Details tab on the bottom panel.
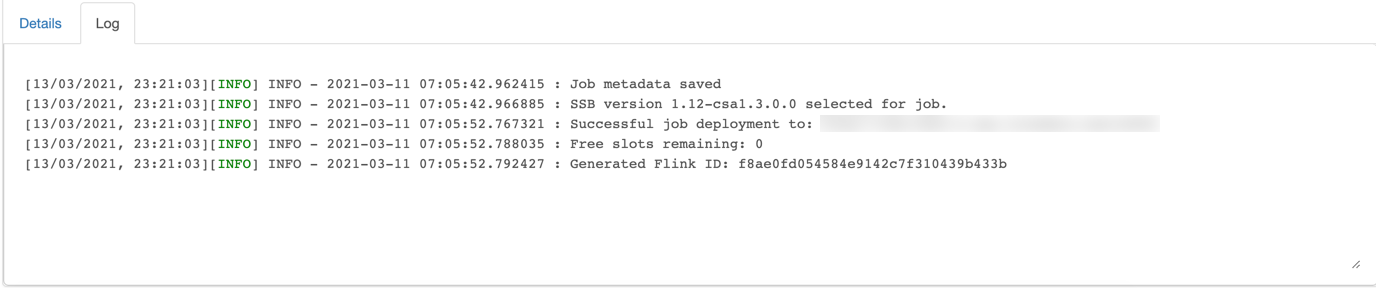
Select the Log tab on the bottom panel.
The Logs tab shows detailed logging from the Flink job itself - any exceptions will be logged
here. As the job processes messages, a count of messages processed is spooled to the log every 5
seconds:
8/13/2019, 9:42:49 AM - INFO - 2019-08-08 19:24:17.752157 : 5 Second Count:
        2502
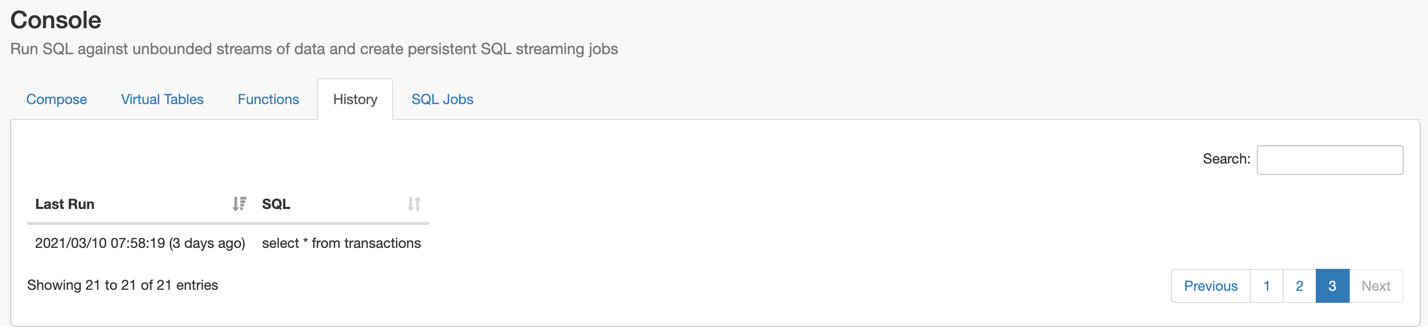
History of SQL jobs
You can review all the SQL jobs that were executed on the History main tab. When you click on
one of the SQL jobs, the SQL query and the job parameters will be automatically imported to
the SQL window for execution. You can filter the SQL jobs by the Last time they run or by
the SQL statement that was executed before.
Using the Flink Dashboard
You can also monitor your running SQL jobs using the Flink Dashboard. You can easily reach the
Flink Dashboard on the SQL jobs tab under the Console main menu. When clicking on the Flink
Dashboard, you will be redirected to the Flink Dashboard interface.