Get started with the Cloudera Surveyor for Apache Kafka UI
The Cloudera Surveyor UI provides a comprehensive set of features to manage and monitor Kafka entities such as clusters, brokers, topics, and consumer groups across dedicated overview and details pages.
The UI organizes functionality into dedicated pages accessible from the left-hand navigation, where you can manage core Kafka entities including clusters, brokers, topics, and consumer groups. When an instance name is configured for the deployment, it is displayed in the header to identify the Cloudera Surveyor instance.
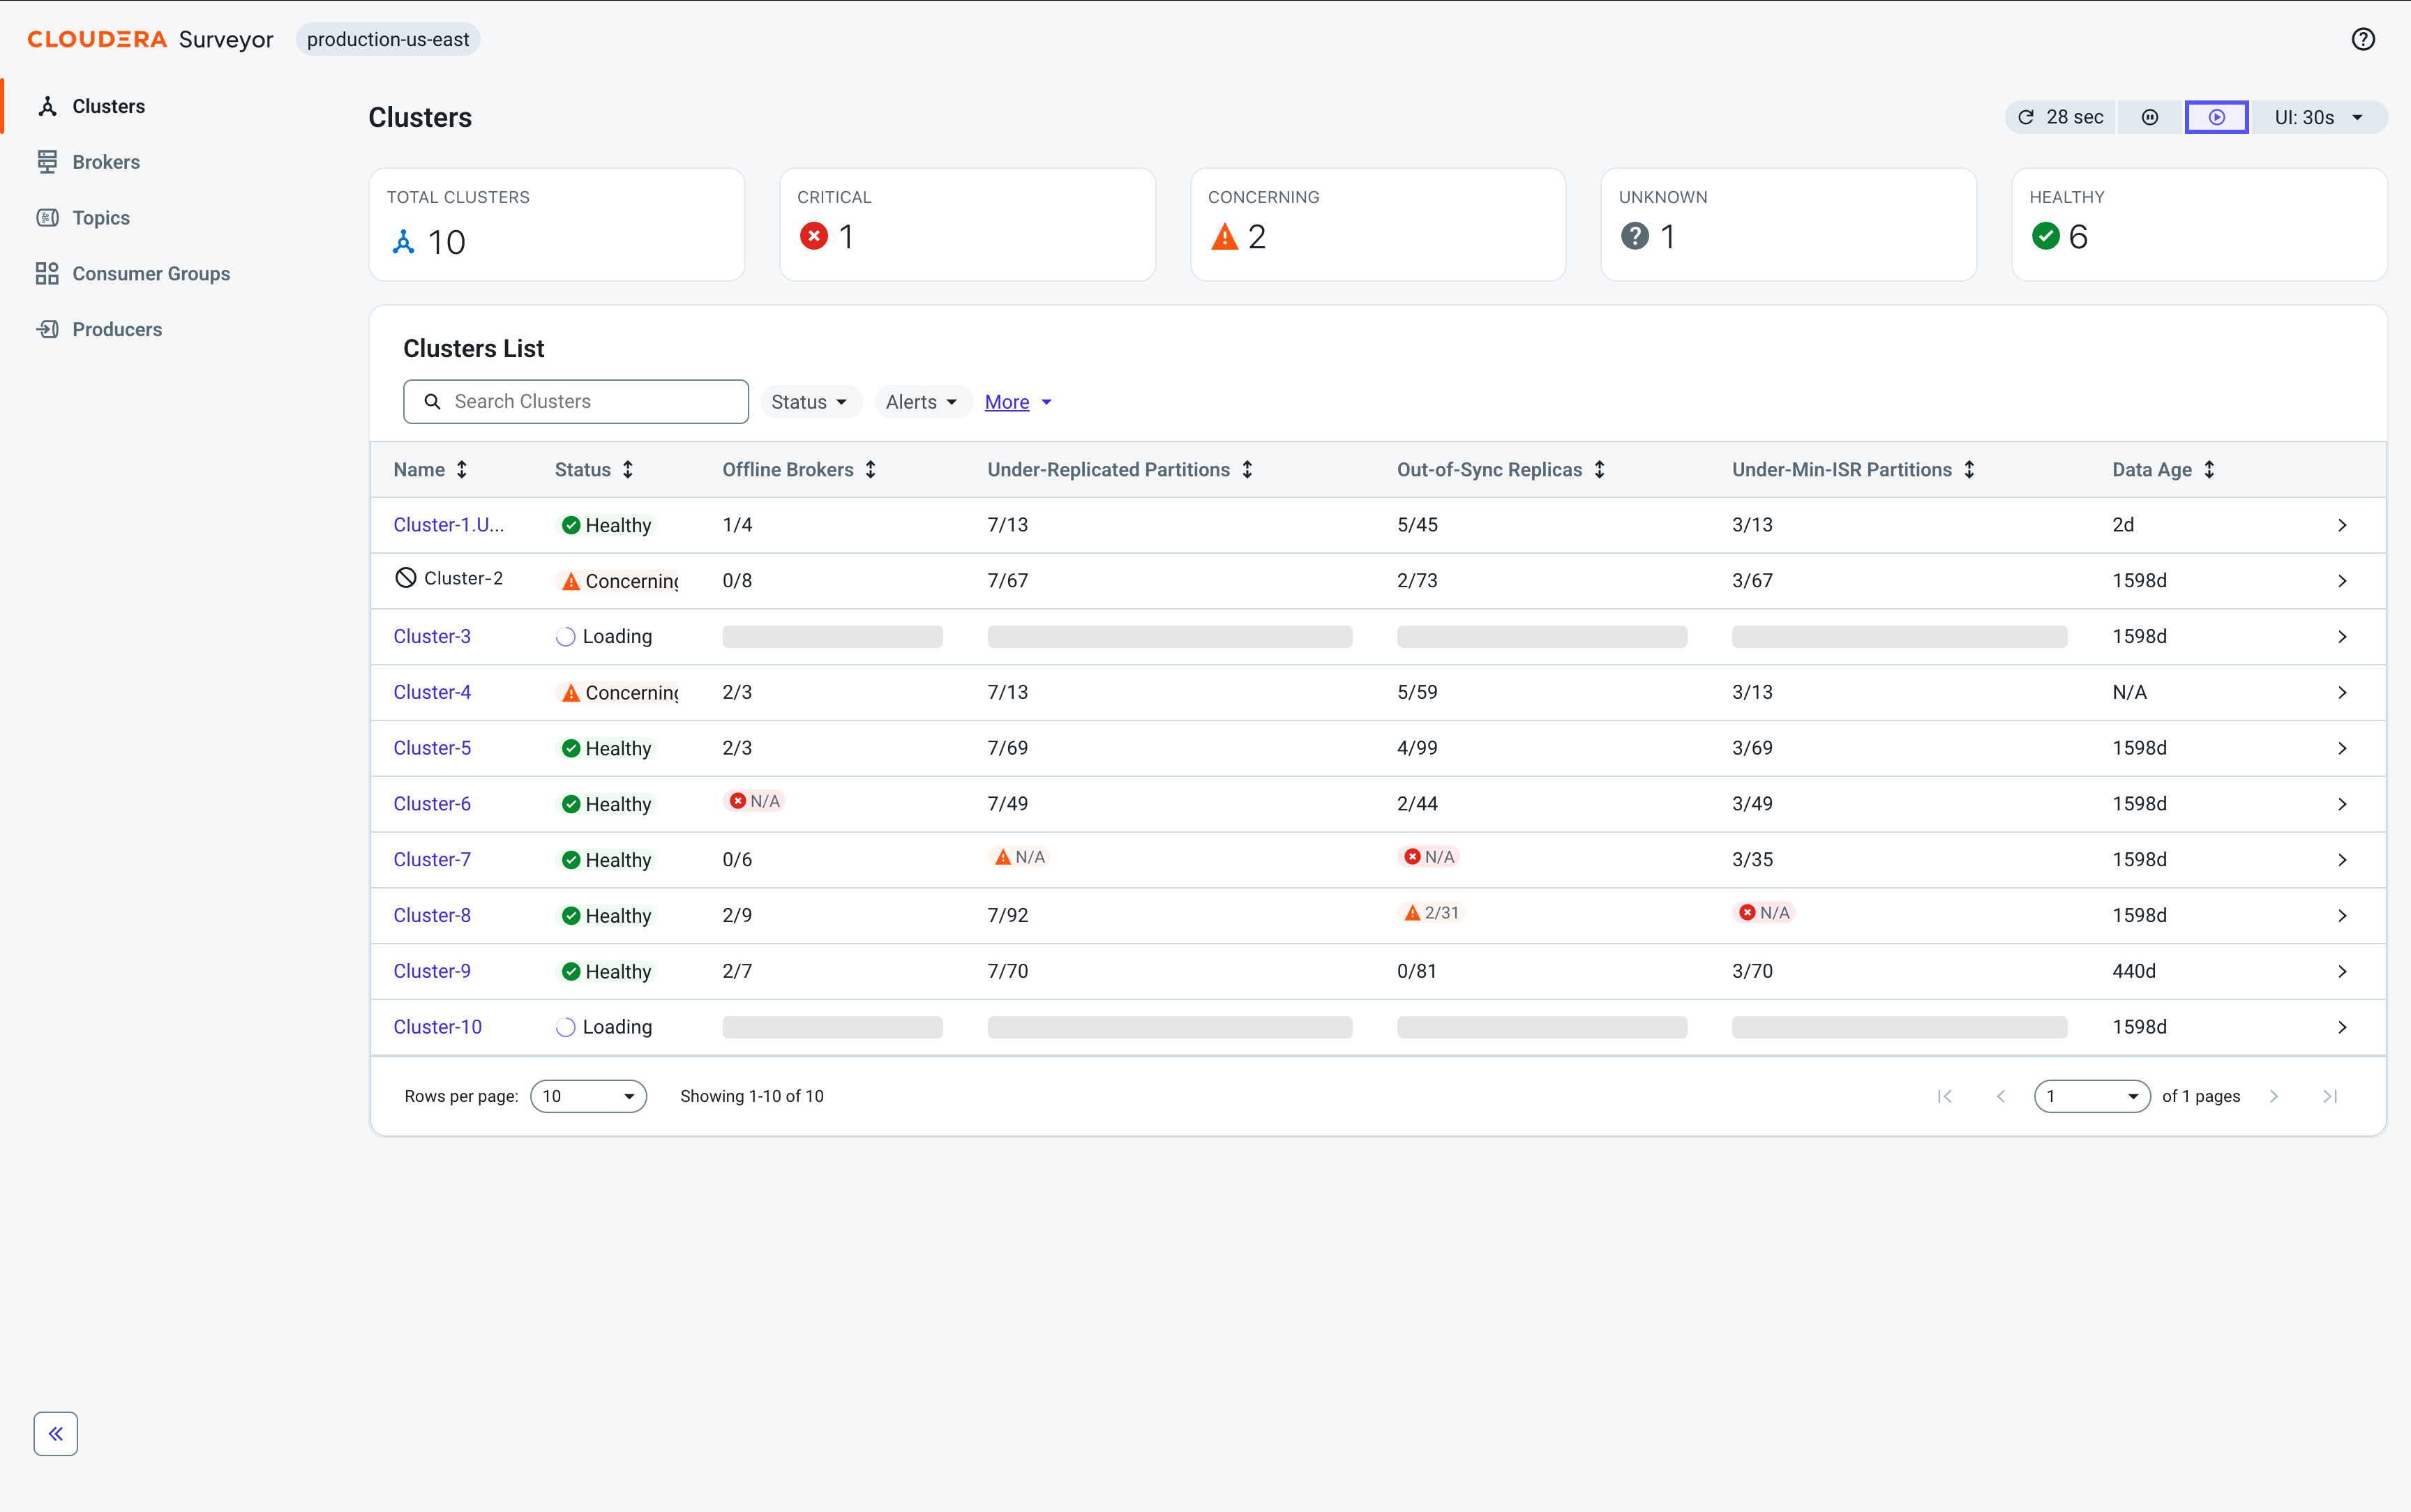
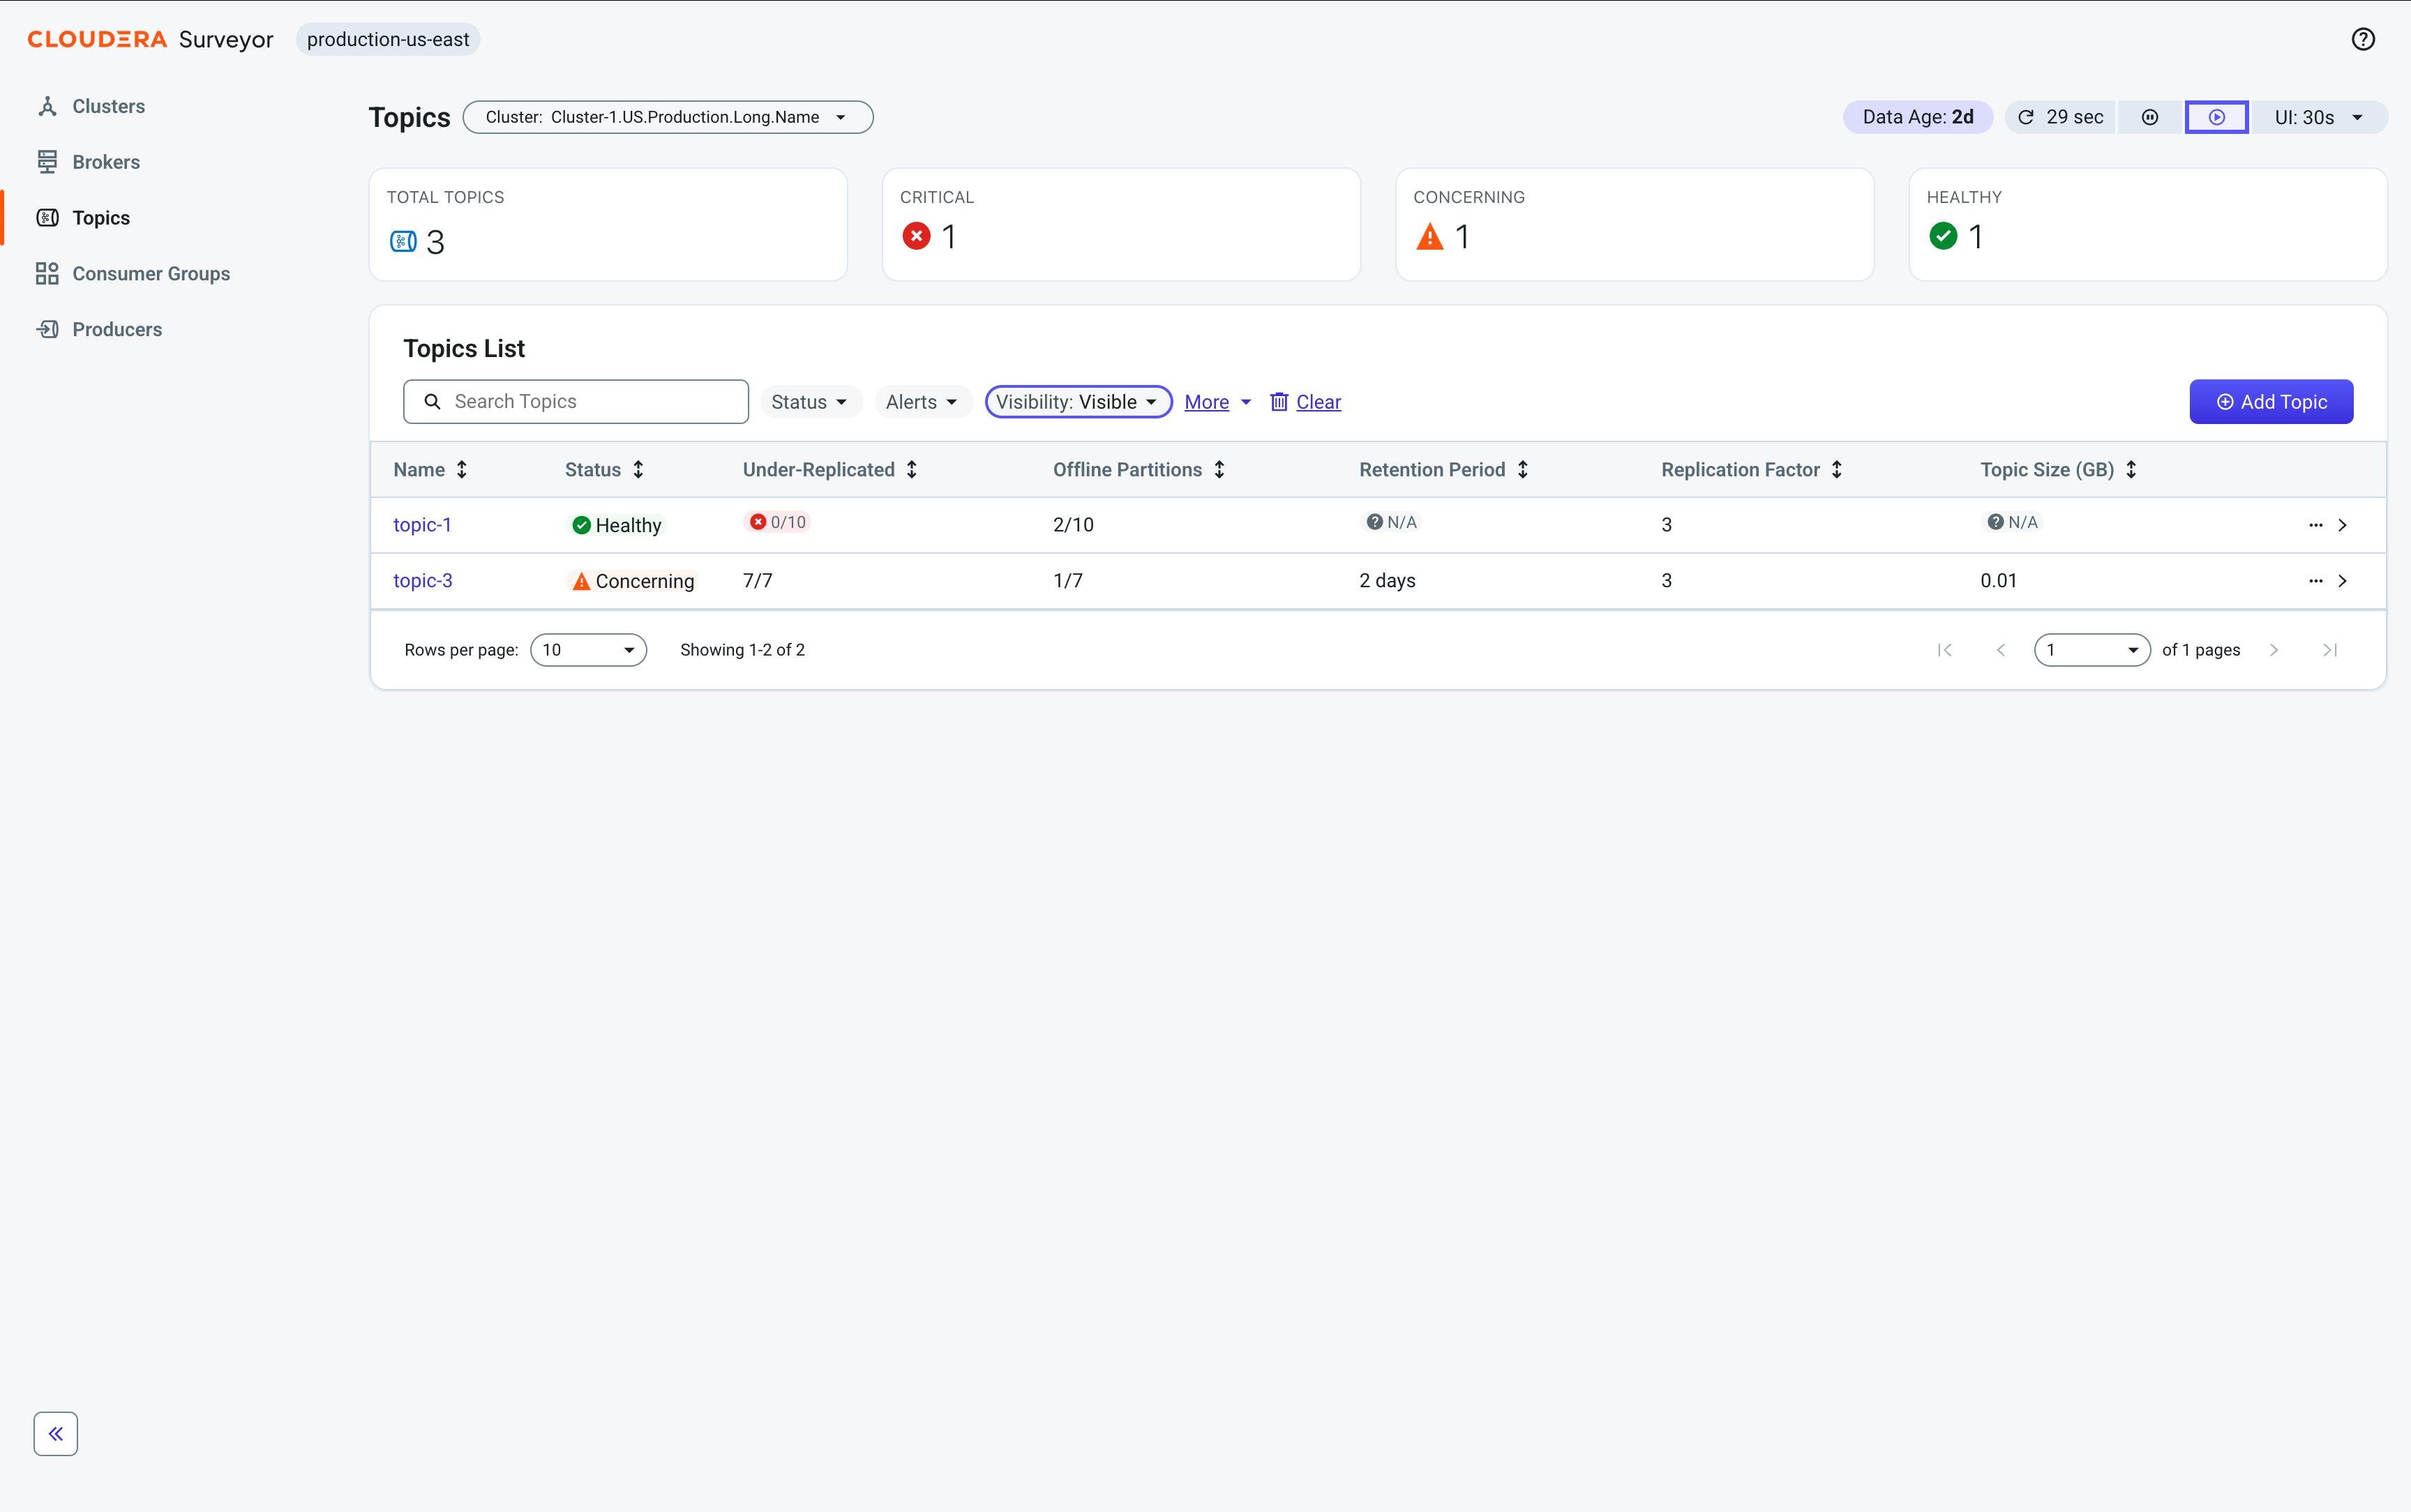
Each left-hand navigation item leads to an overview page, which displays an overview of all entities of that type. From an overview page, clicking an entity name opens the corresponding details page, which provides in-depth information about the selected individual entity.
Alert and status icons such as  ,
,  ,
,  ,
,  are used throughout the UI
to surface entity health, and highlight issues and errors at a glance.
are used throughout the UI
to surface entity health, and highlight issues and errors at a glance.
 Edit
Properties option.
Edit
Properties option.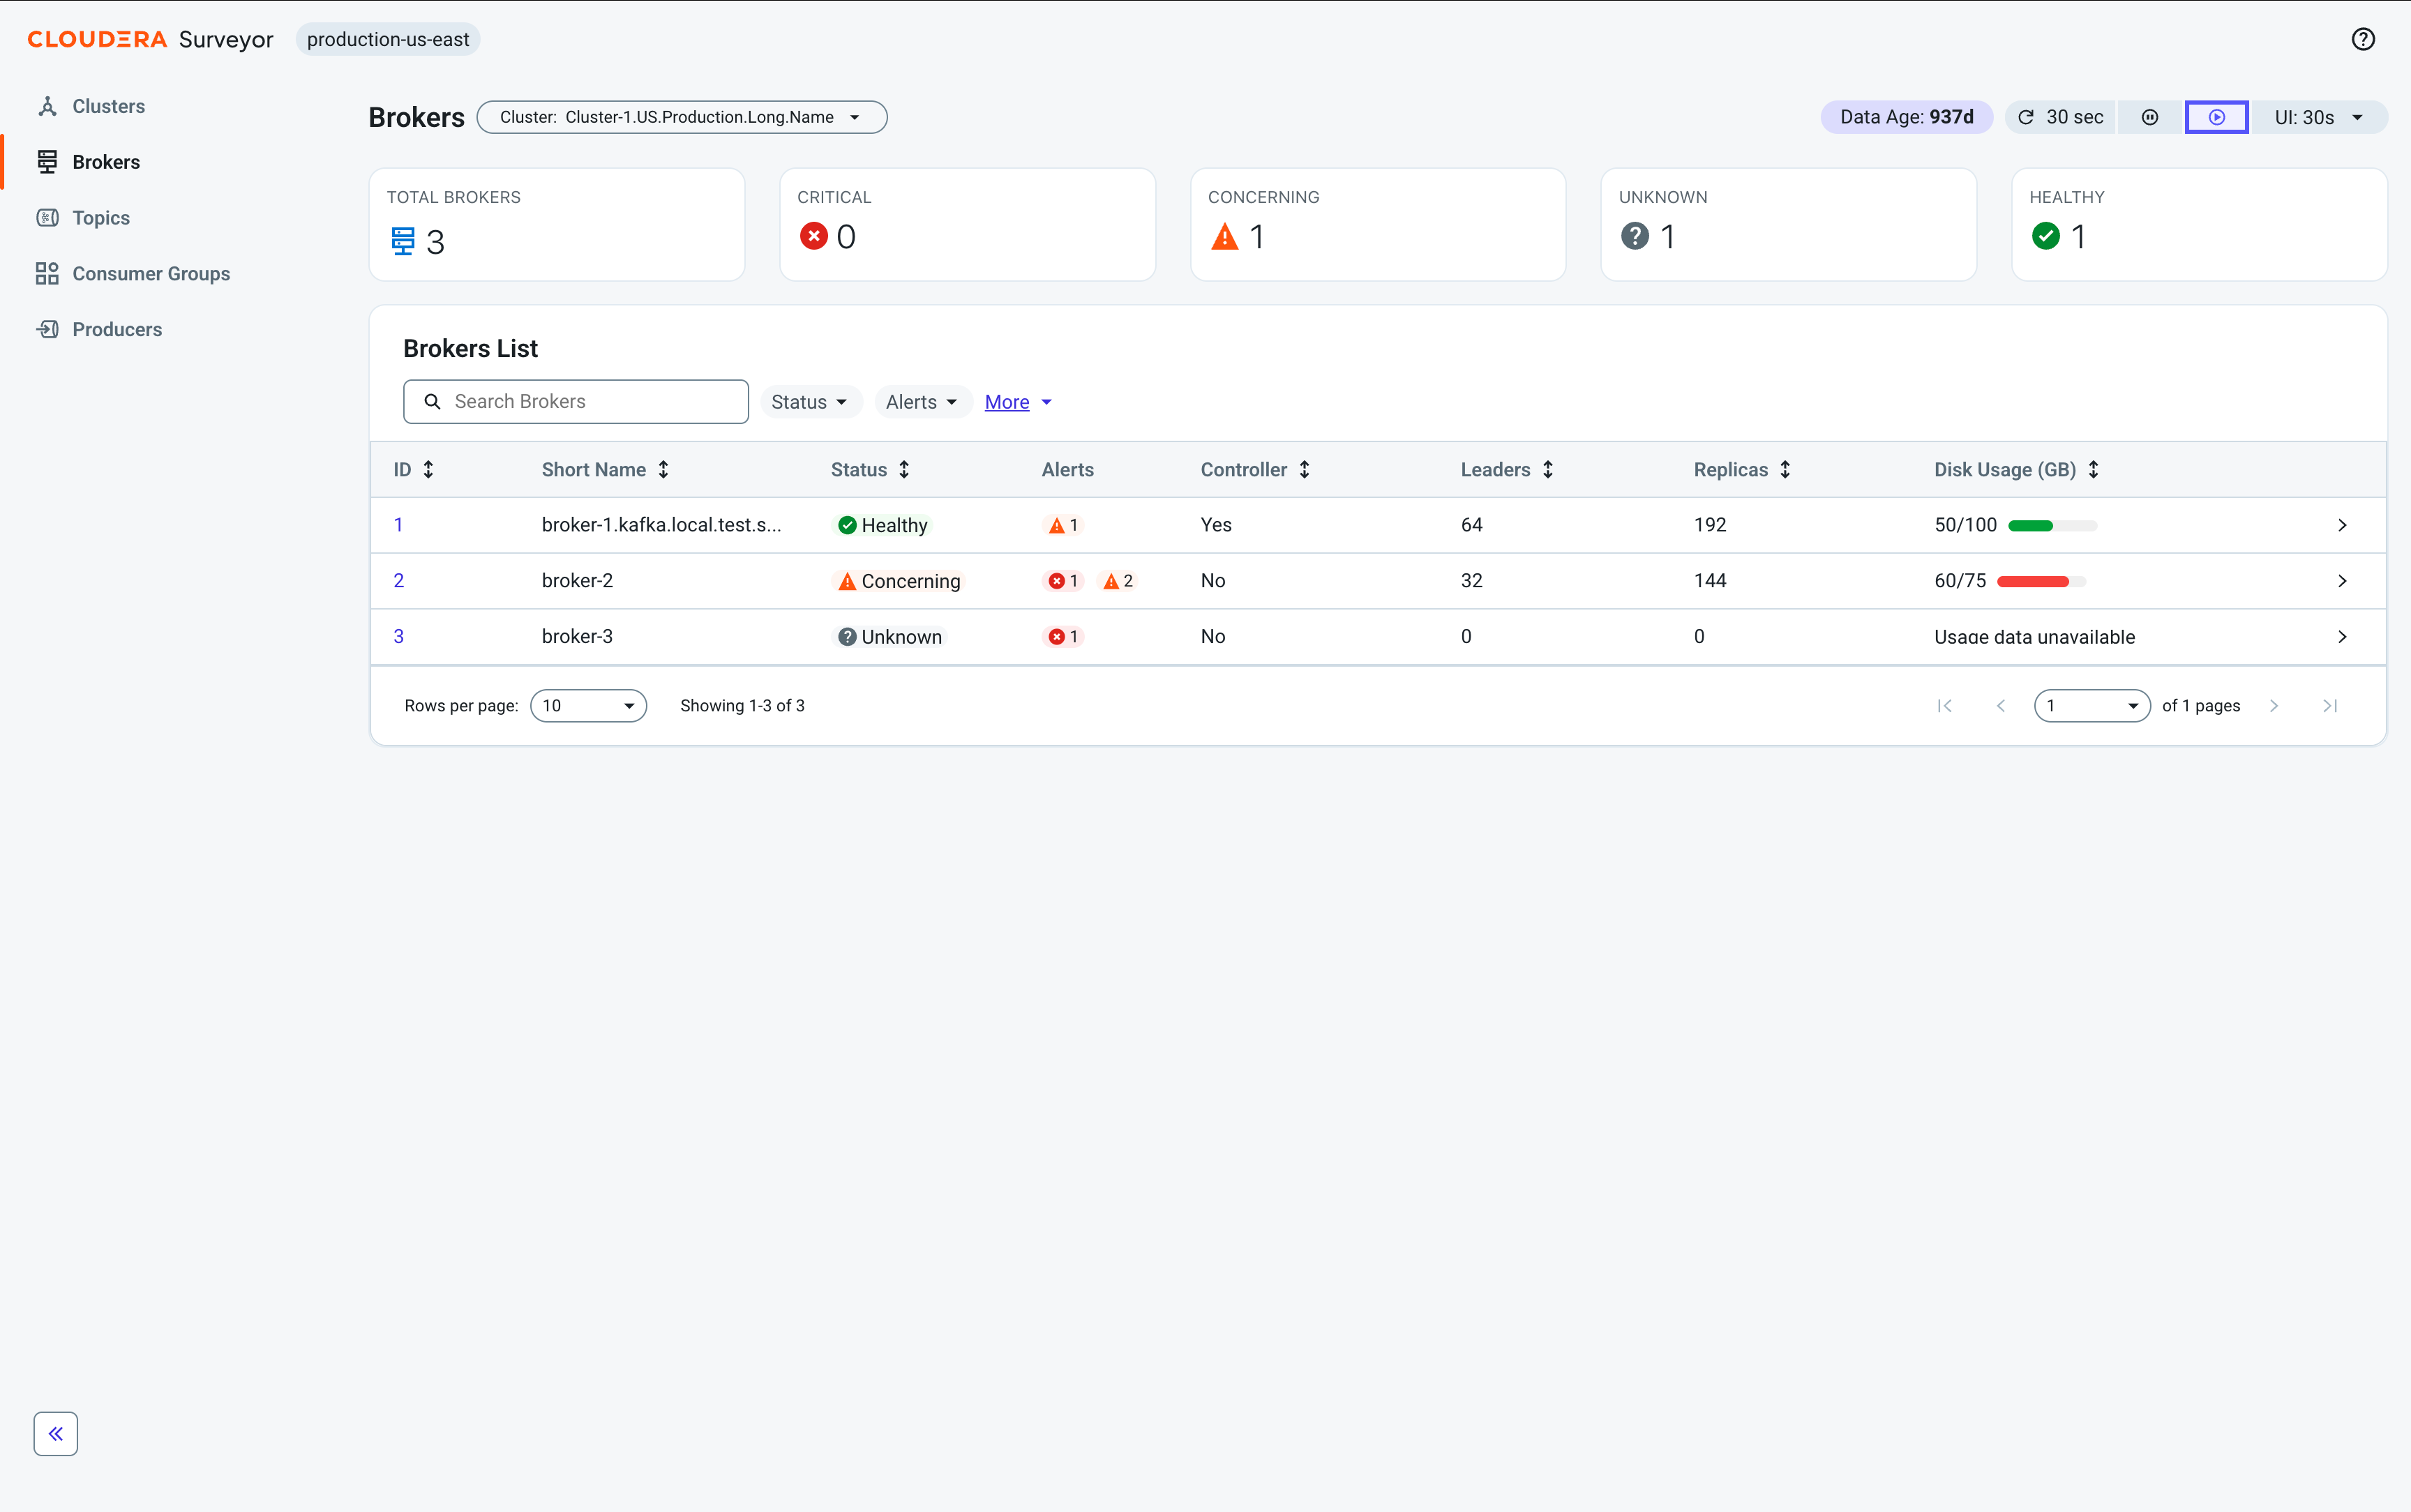
 Delete option.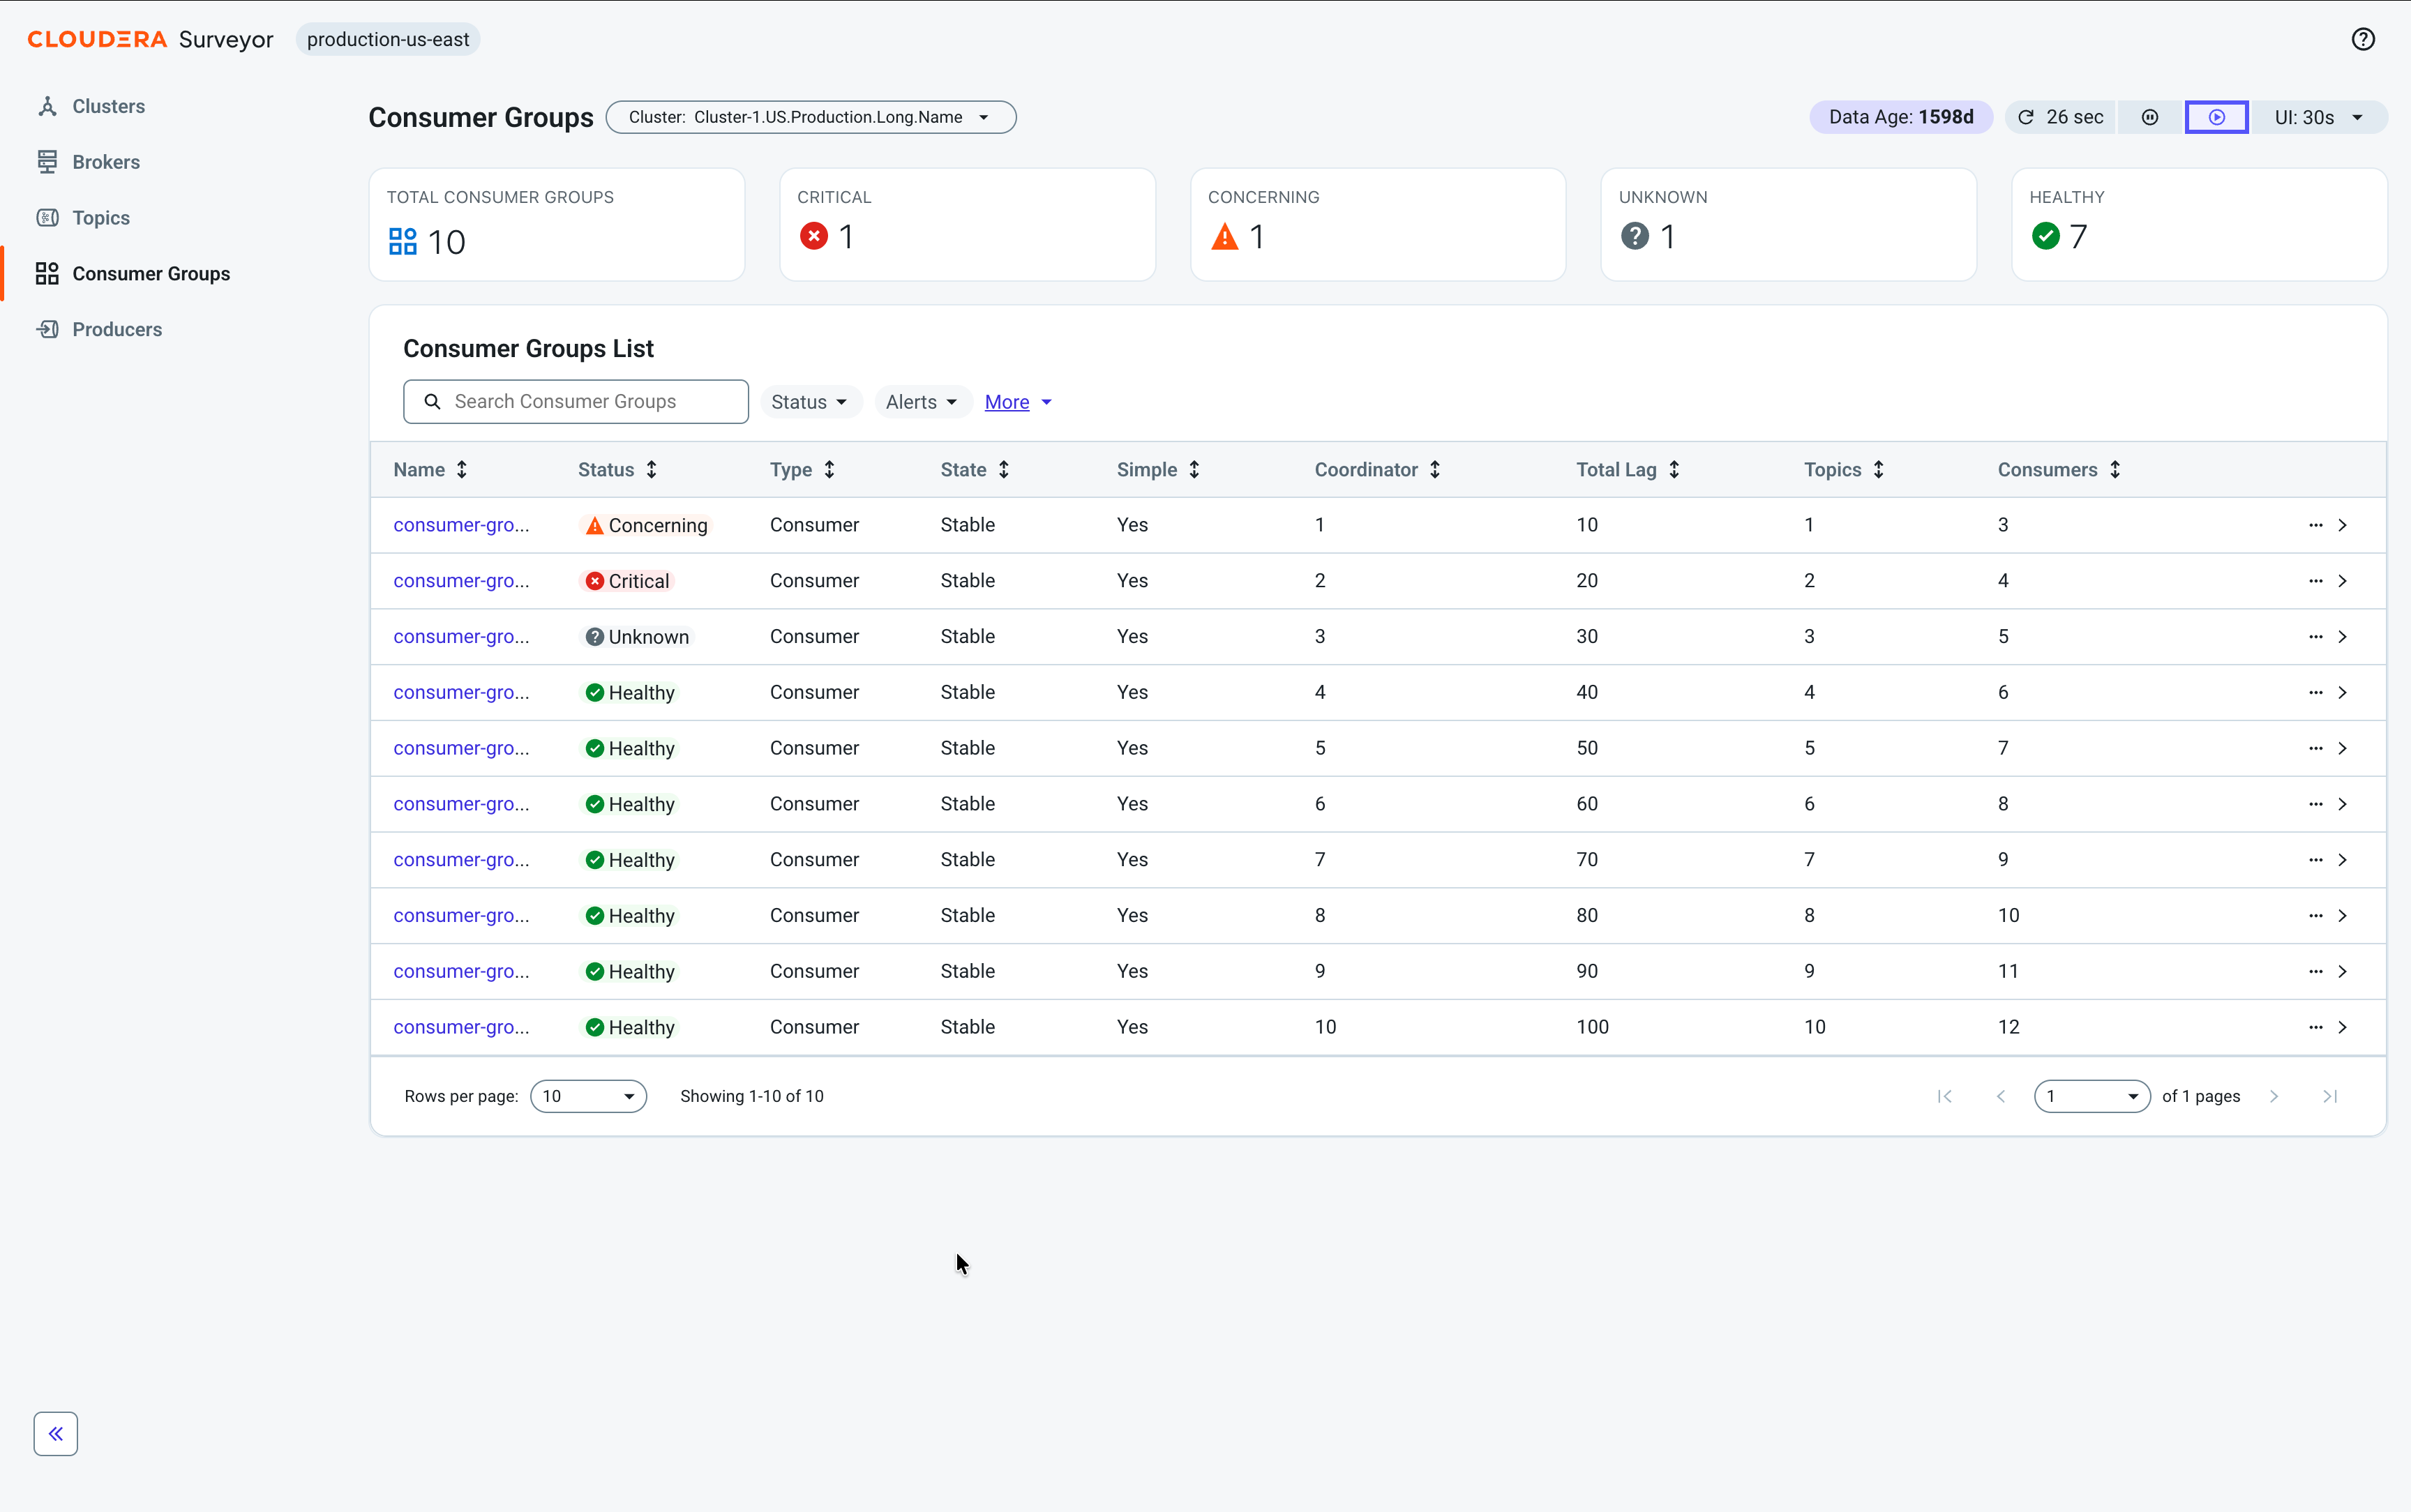
Entity summaries
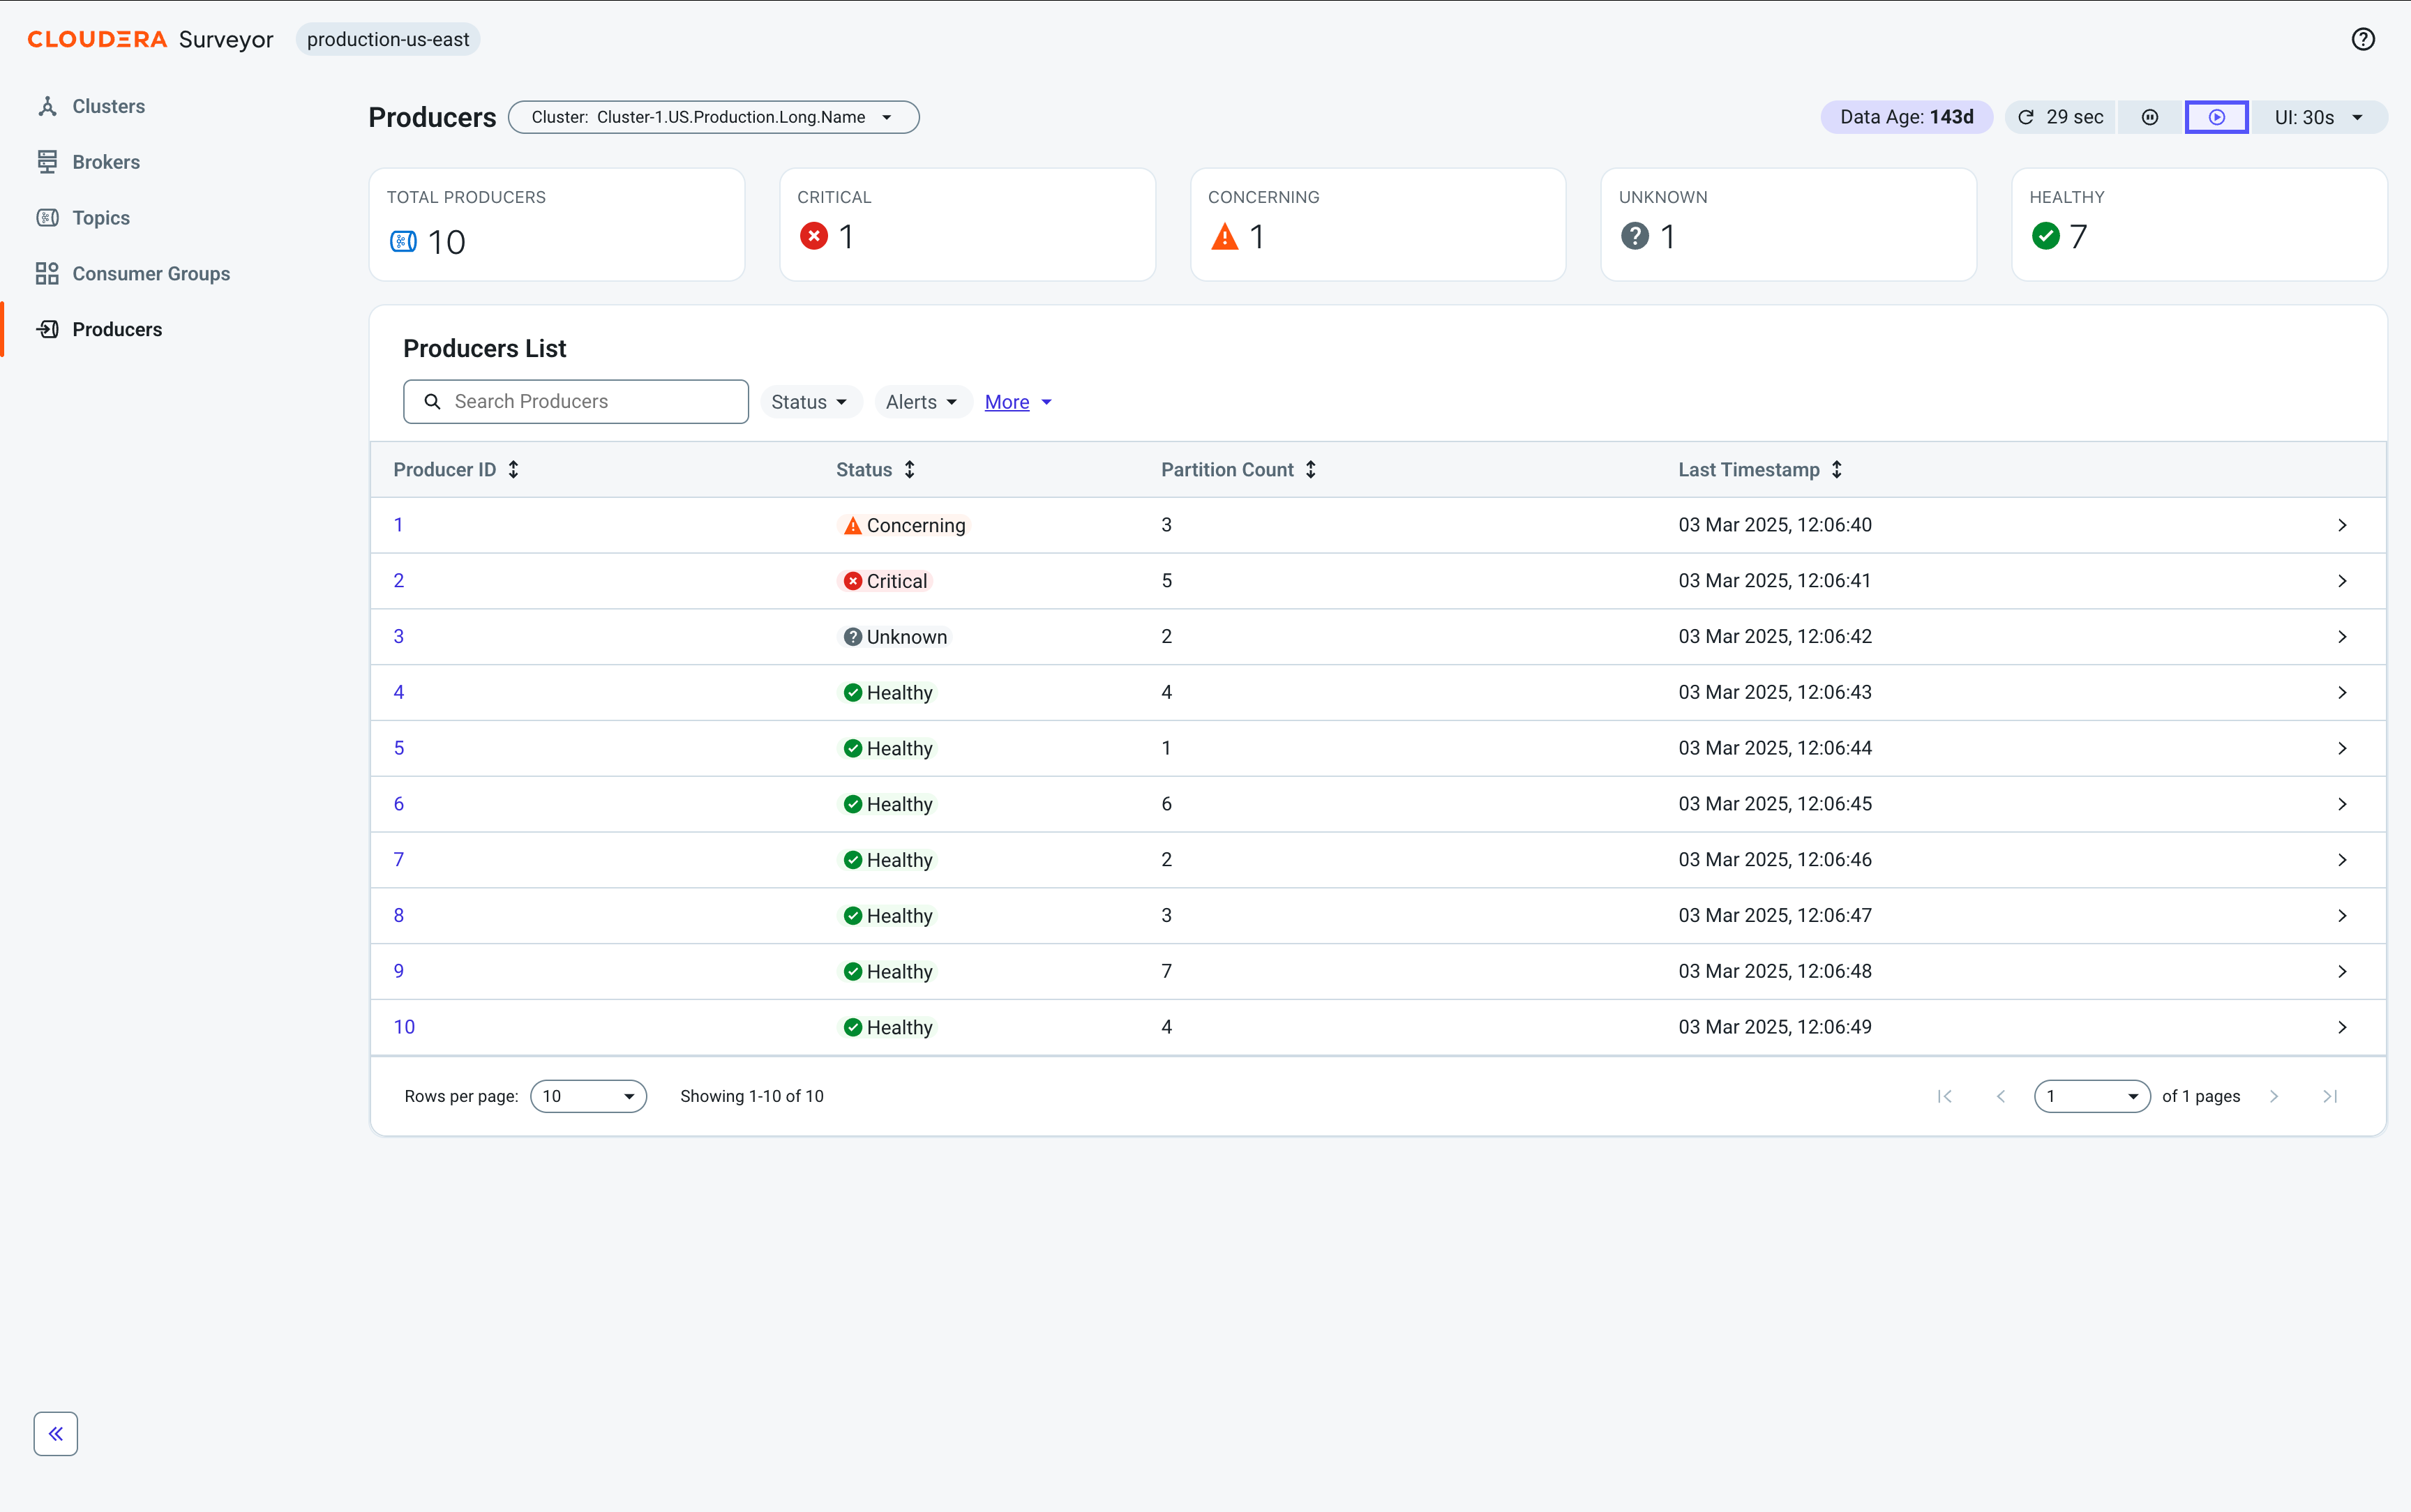
All pages display a summary section at the top providing an at-a-glance view of entity health and important metrics without needing to scroll through detailed tables.
On overview pages the summary displays the total count of entities and a health breakdown displaying how many entities are in each status category. Each status category is displayed in a separate tile with an icon and count.
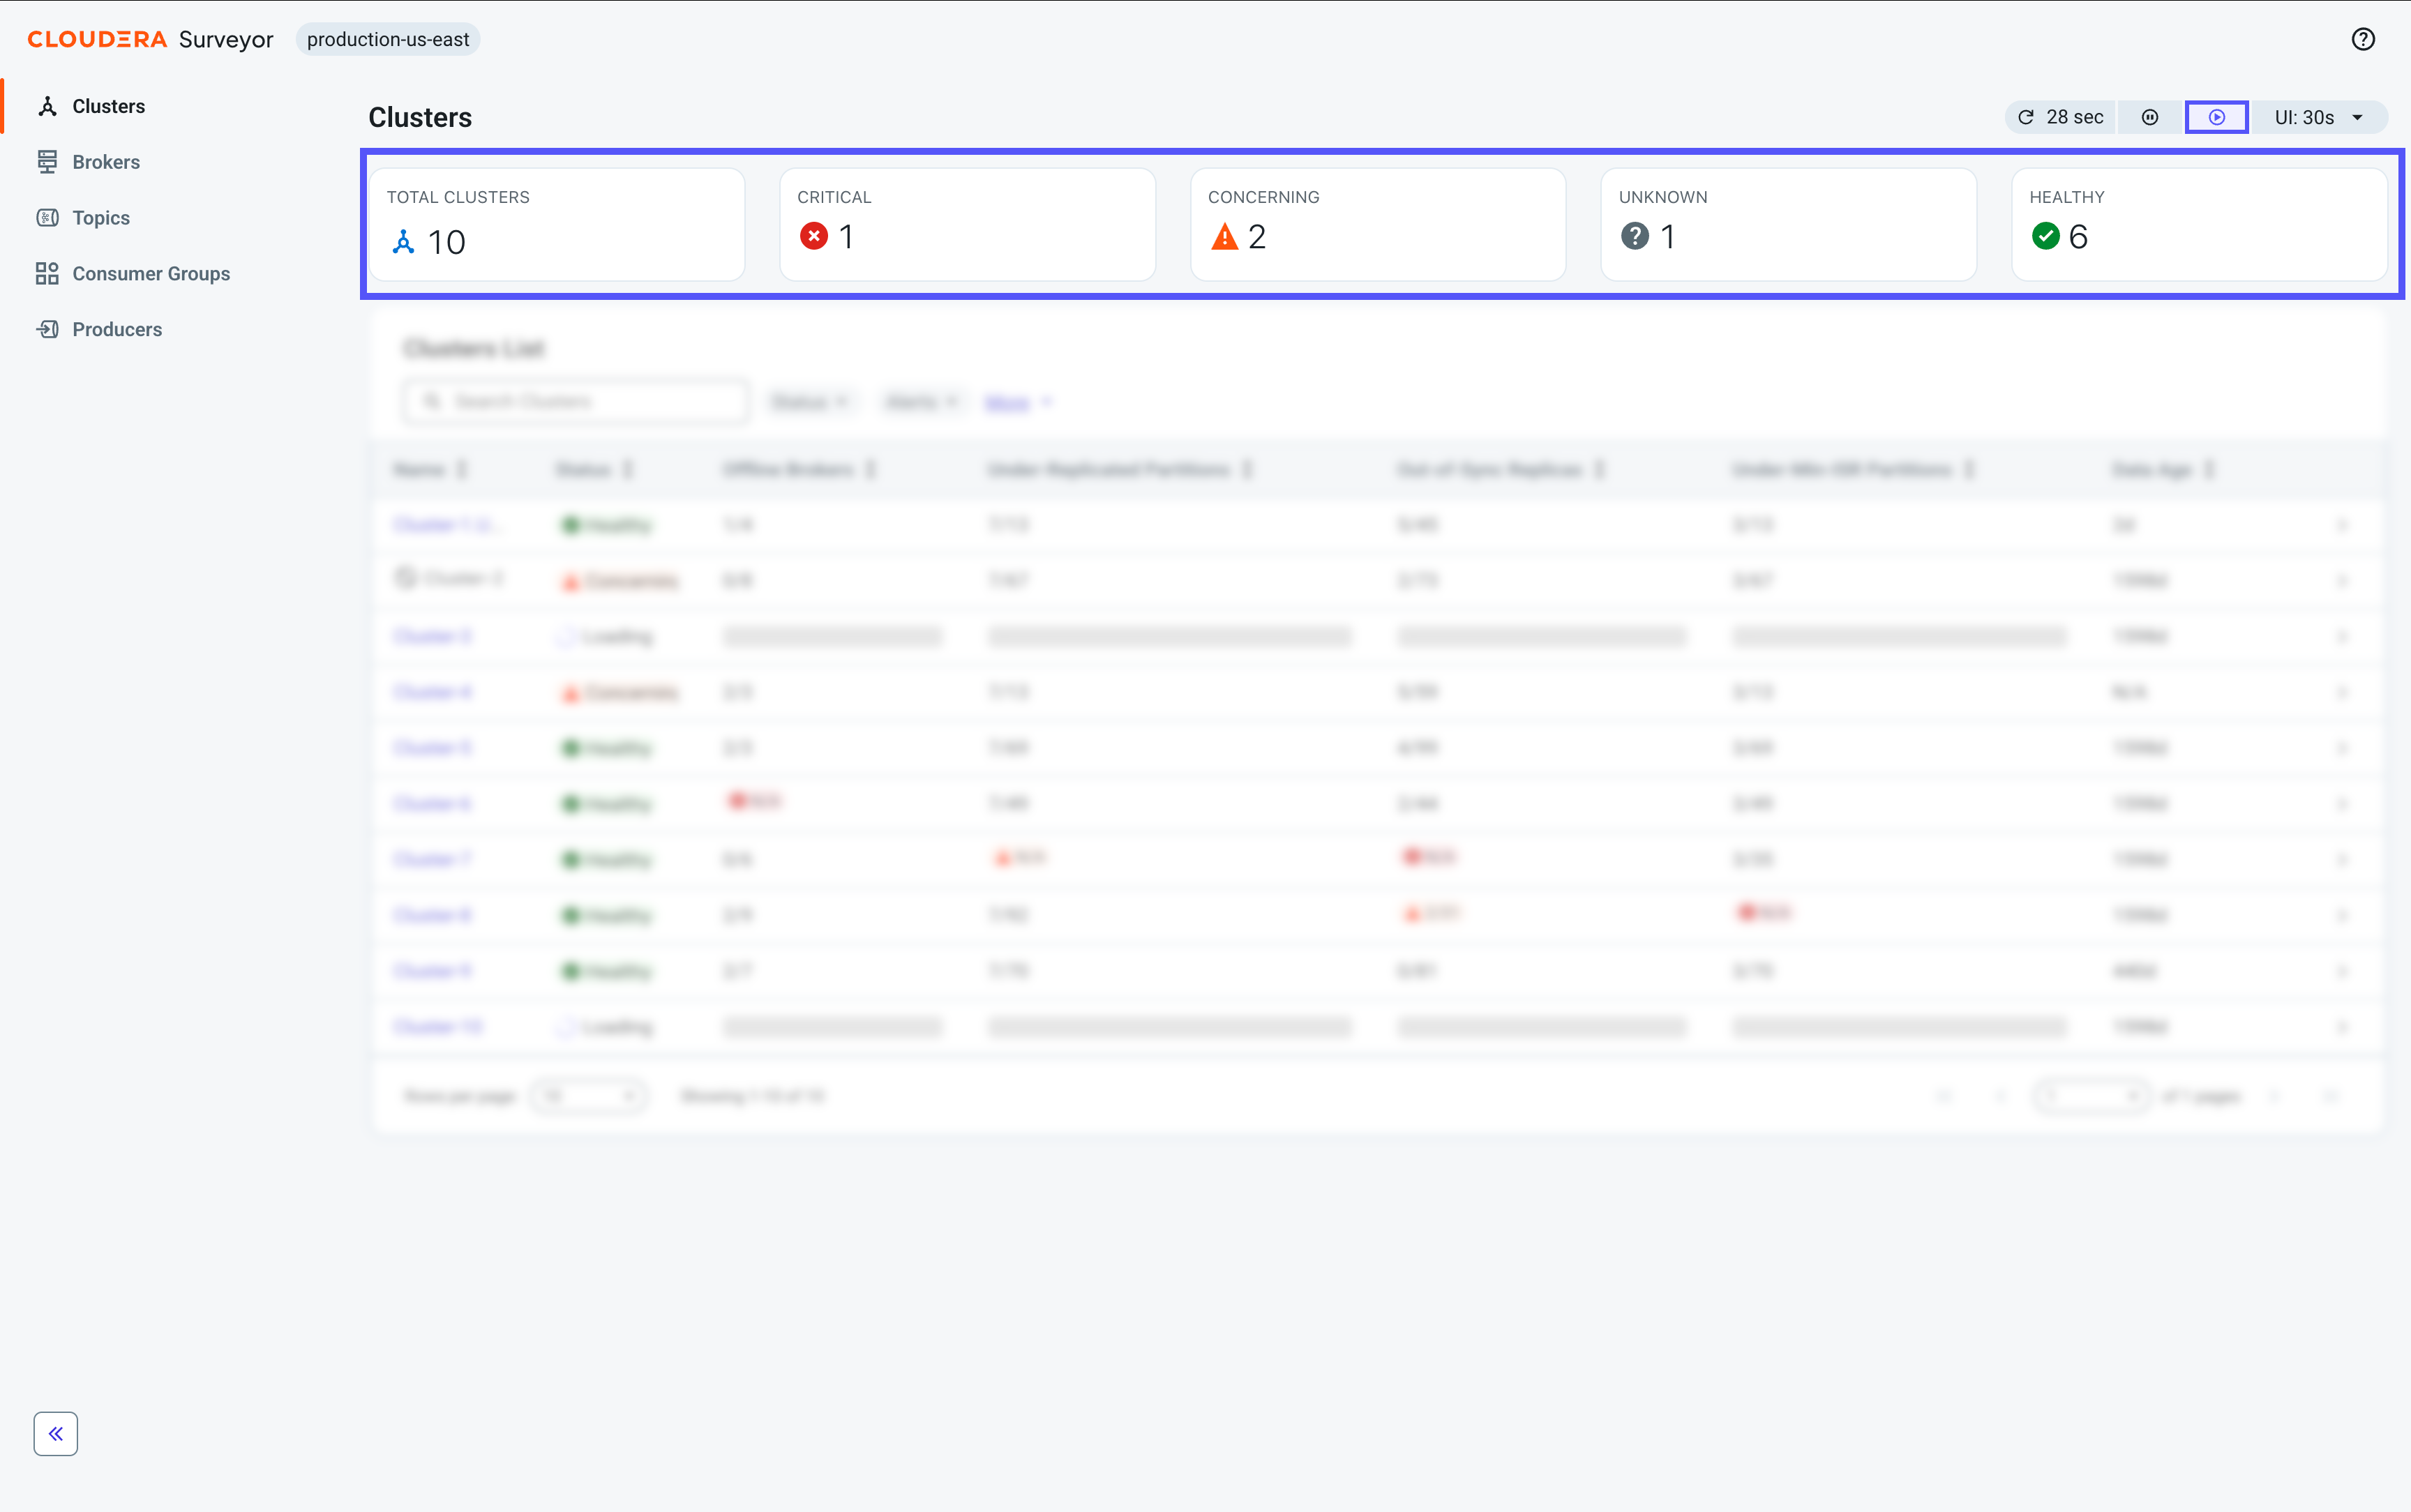
On entity details pages, the summary displays key attributes specific to that entity in two sections. The upper section typically includes the entity's overall status, a count of active alerts by severity, and entity-specific attributes such as disk usage for clusters, state for consumer groups, or topic size for topics. Beneath a dividing line, a lower section provides aggregate counts and summaries of related entities. For example, the Cluster Details page displays total counts of related entities such as topics, brokers, consumer groups, and partitions.
Tables and filtering
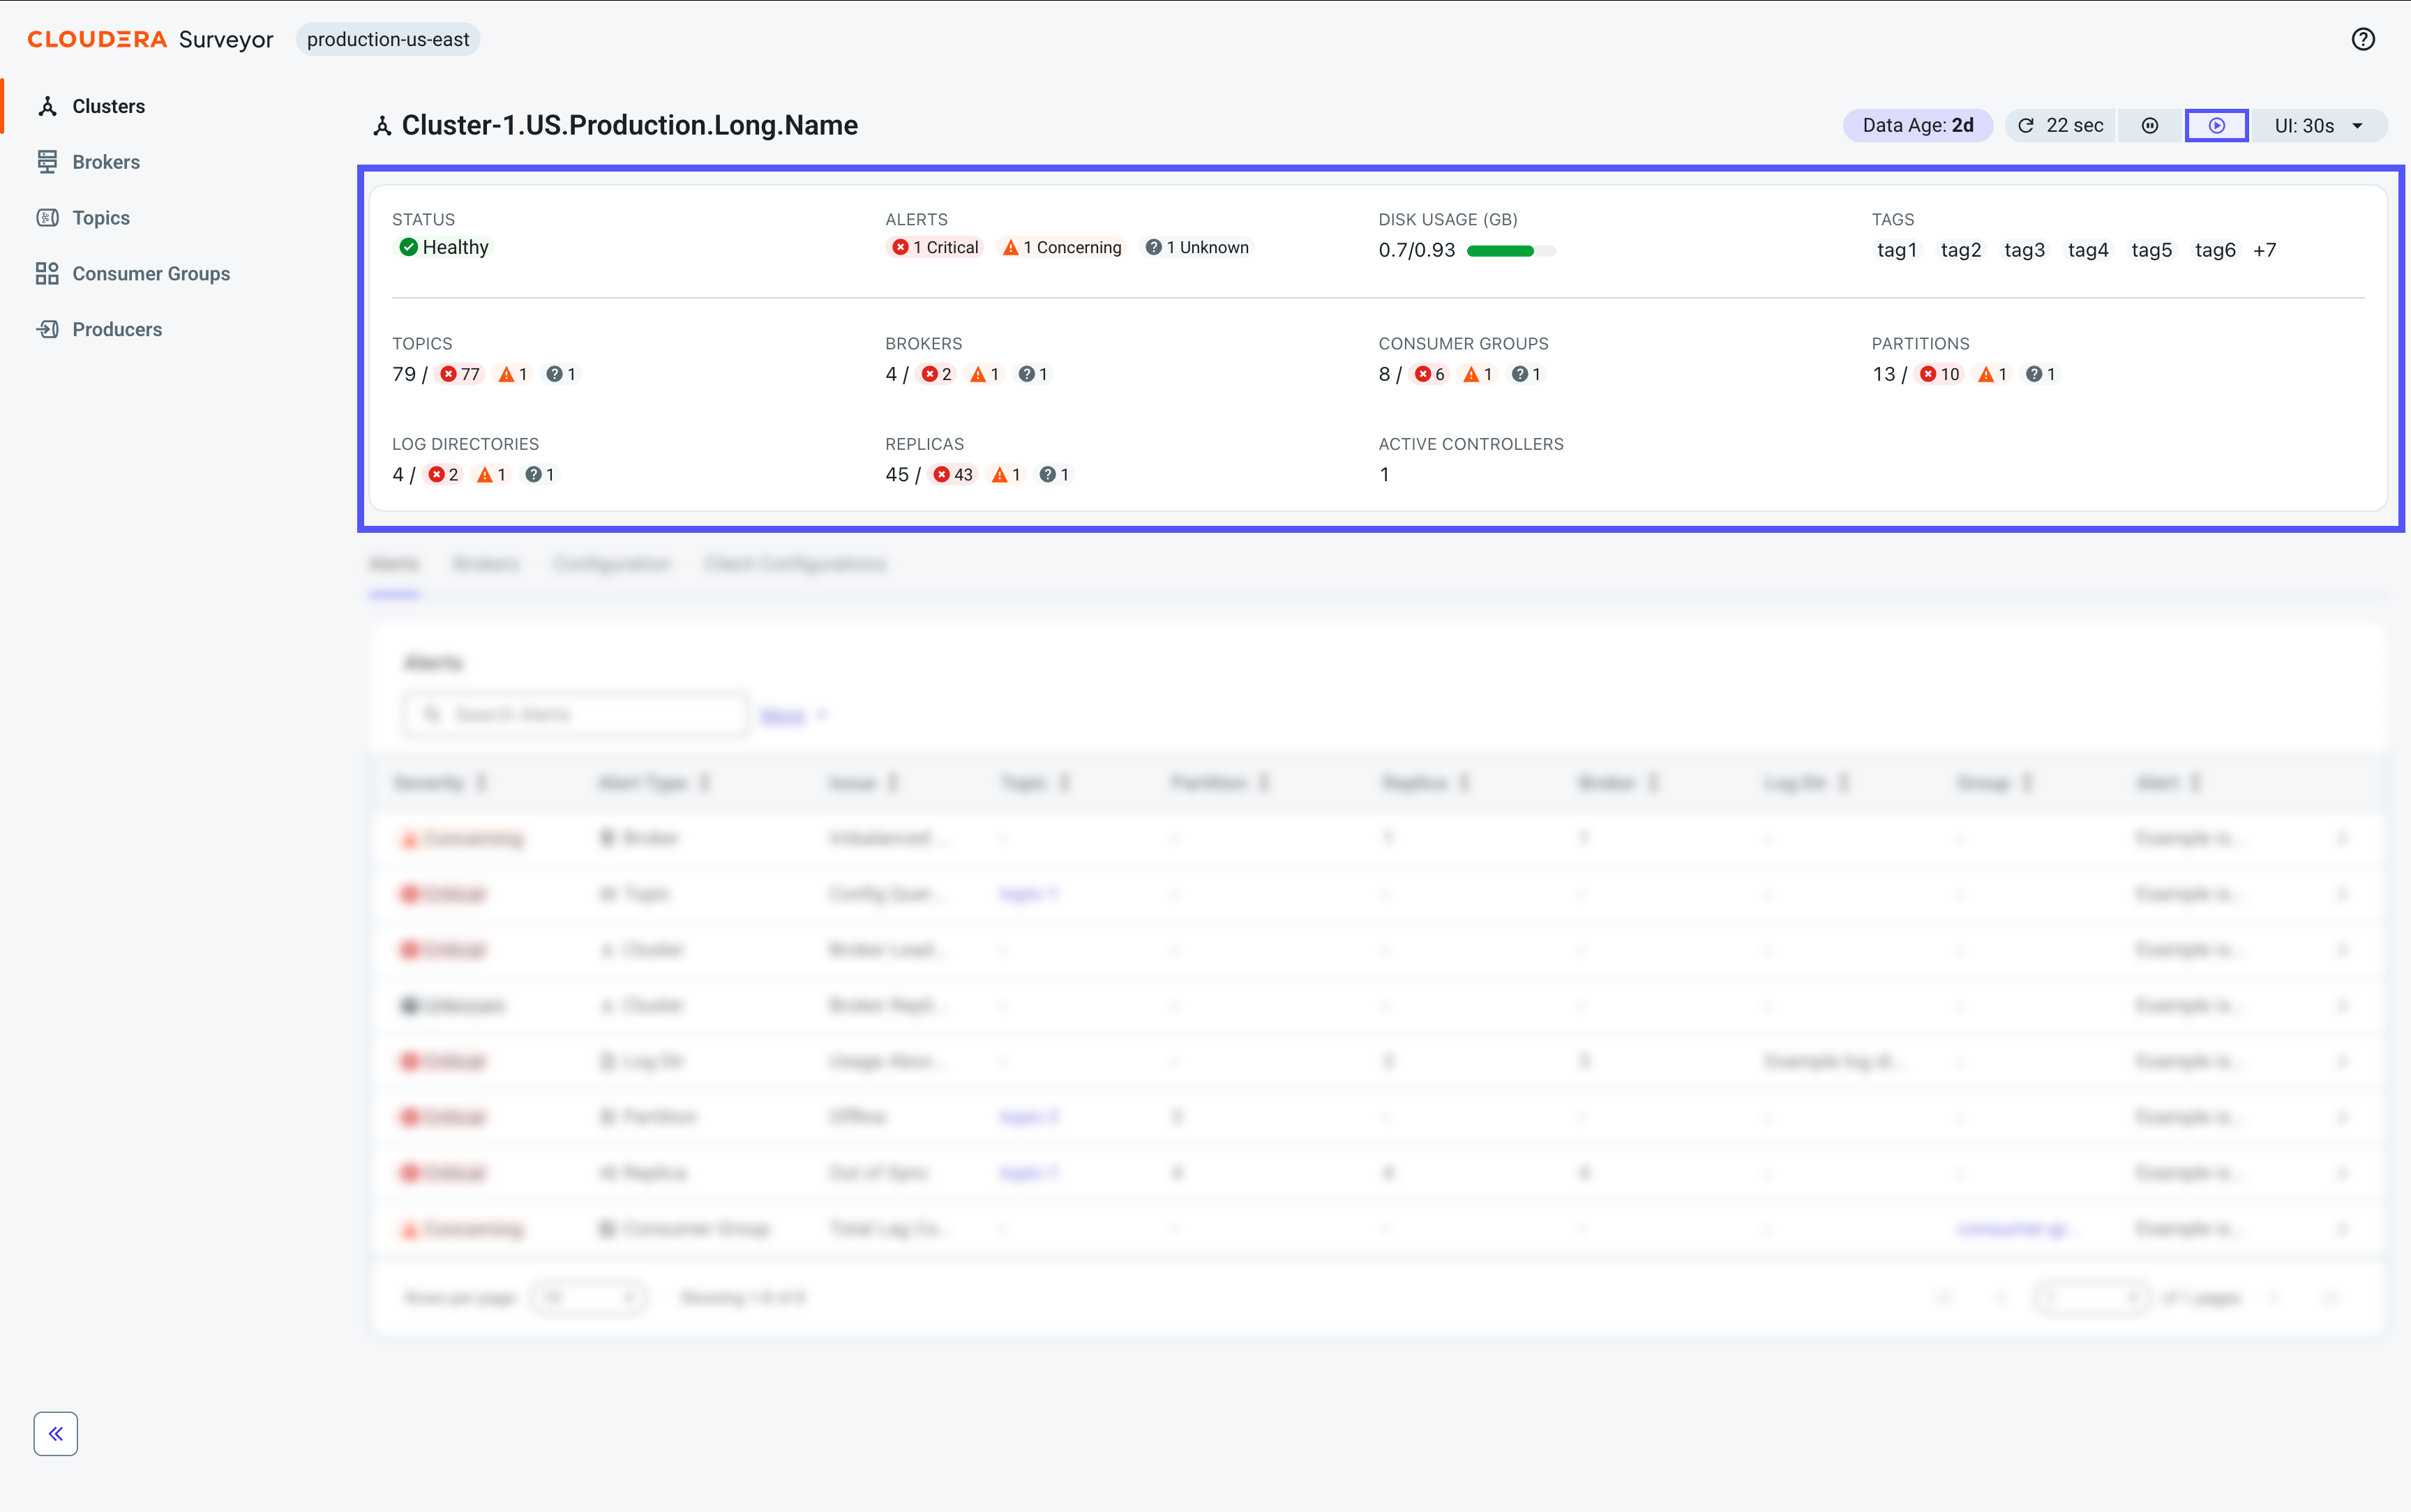
Tables in Cloudera Surveyor support combinable filters displayed as pills in the filter bar, removable individually or all at once. Active filters persist in the URL, enabling you to bookmark and share specific filtered views.
Filters and controls
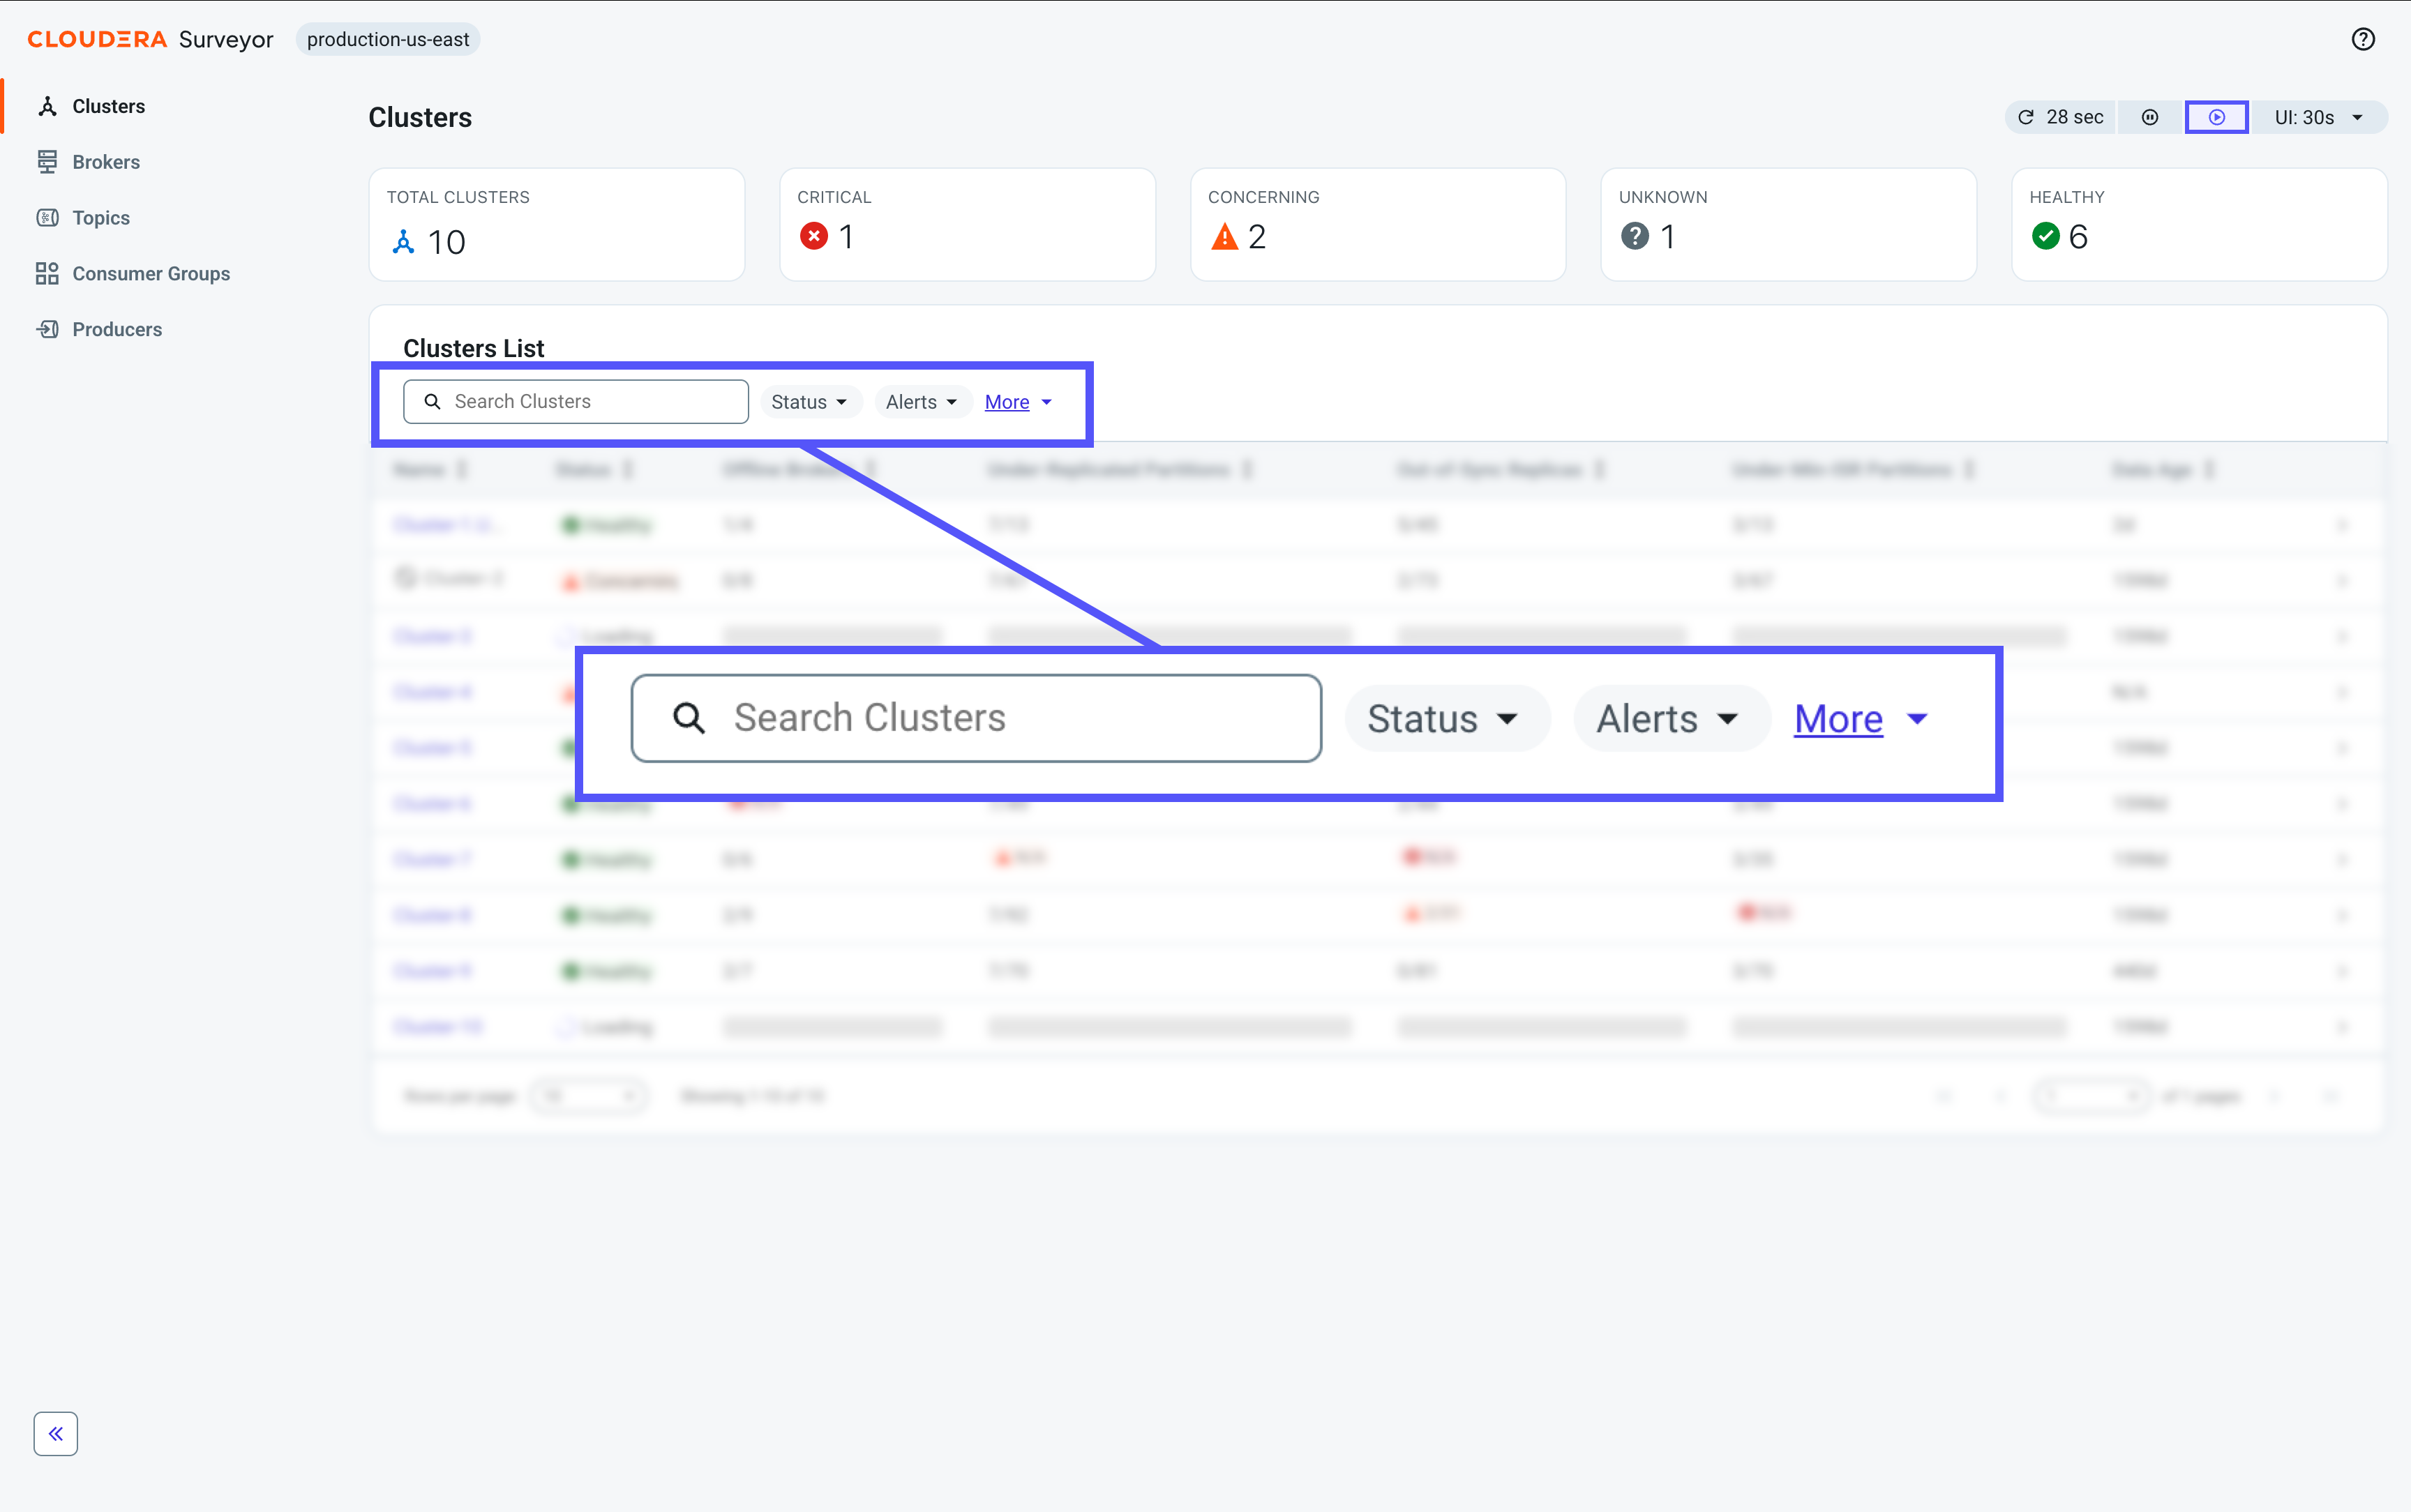
All tables include filters and filtering controls above the table. Overview pages typically provide the same set of quick filter drop-down lists for common filtering needs, while details pages and their tabs offer page-specific options depending on the data being displayed.
-
Search box – Free–text search that filters by entity name.
-
Status drop-down list – Quick filter for entity status. Multiple statuses can be selected at once.
-
Alerts drop-down list – Quick filter to display only entities with specific alert severities. Only one severity can be selected at a time.
-
More drop-down list – Custom filtering with full control over options and filter operations.
Custom filtering
Access custom filtering using the More drop-down list. Select an option from the list, then choose a filter operation and specify your criteria. The available options are tailored to each page or tab and generally include a mix of visible table columns and additional entity attributes. Some visible table columns might not be available as filter options.

Filter operations
Filter operations depend on the data type of the option you selected. The following operations are available per data types:
-
Text fields (such as names, IDs, hosts):
-
Equals / Not Equal To – Exact match
-
Contains / Does Not Contain – Partial text match
-
Matches Regular Expression – Pattern matching using regex
-
In / Not In – Match any value from a list
-
-
Numeric fields (such as counts, sizes, offsets):
-
Equals / Not Equal To – Exact match
-
Greater Than / Greater Than or Equal To – Compare numeric values
-
Less Than / Less Than or Equal To – Compare numeric values
-
In / Not In – Match any value from a list
-
-
Enumerated fields (such as status, severity, type):
-
Equals / Not Equal To – Exact match
-
In / Not In – Match any value from a list
-
-
All fields:
-
Is Null – Match null or missing values
-
Entity Details drawer
The Entity Details drawer provides quick access to all Kafka entity attributes in a searchable format organized into sections, without navigating away from the overview table.
Tables for entities such as brokers, topics, and consumer groups display the most important attributes for quick scanning, but each entity has many additional attributes. The Entity Details drawer provides access to all available attributes for the selected entity. Open the drawer by clicking anywhere in a row except the entity name to view the details of that entity.
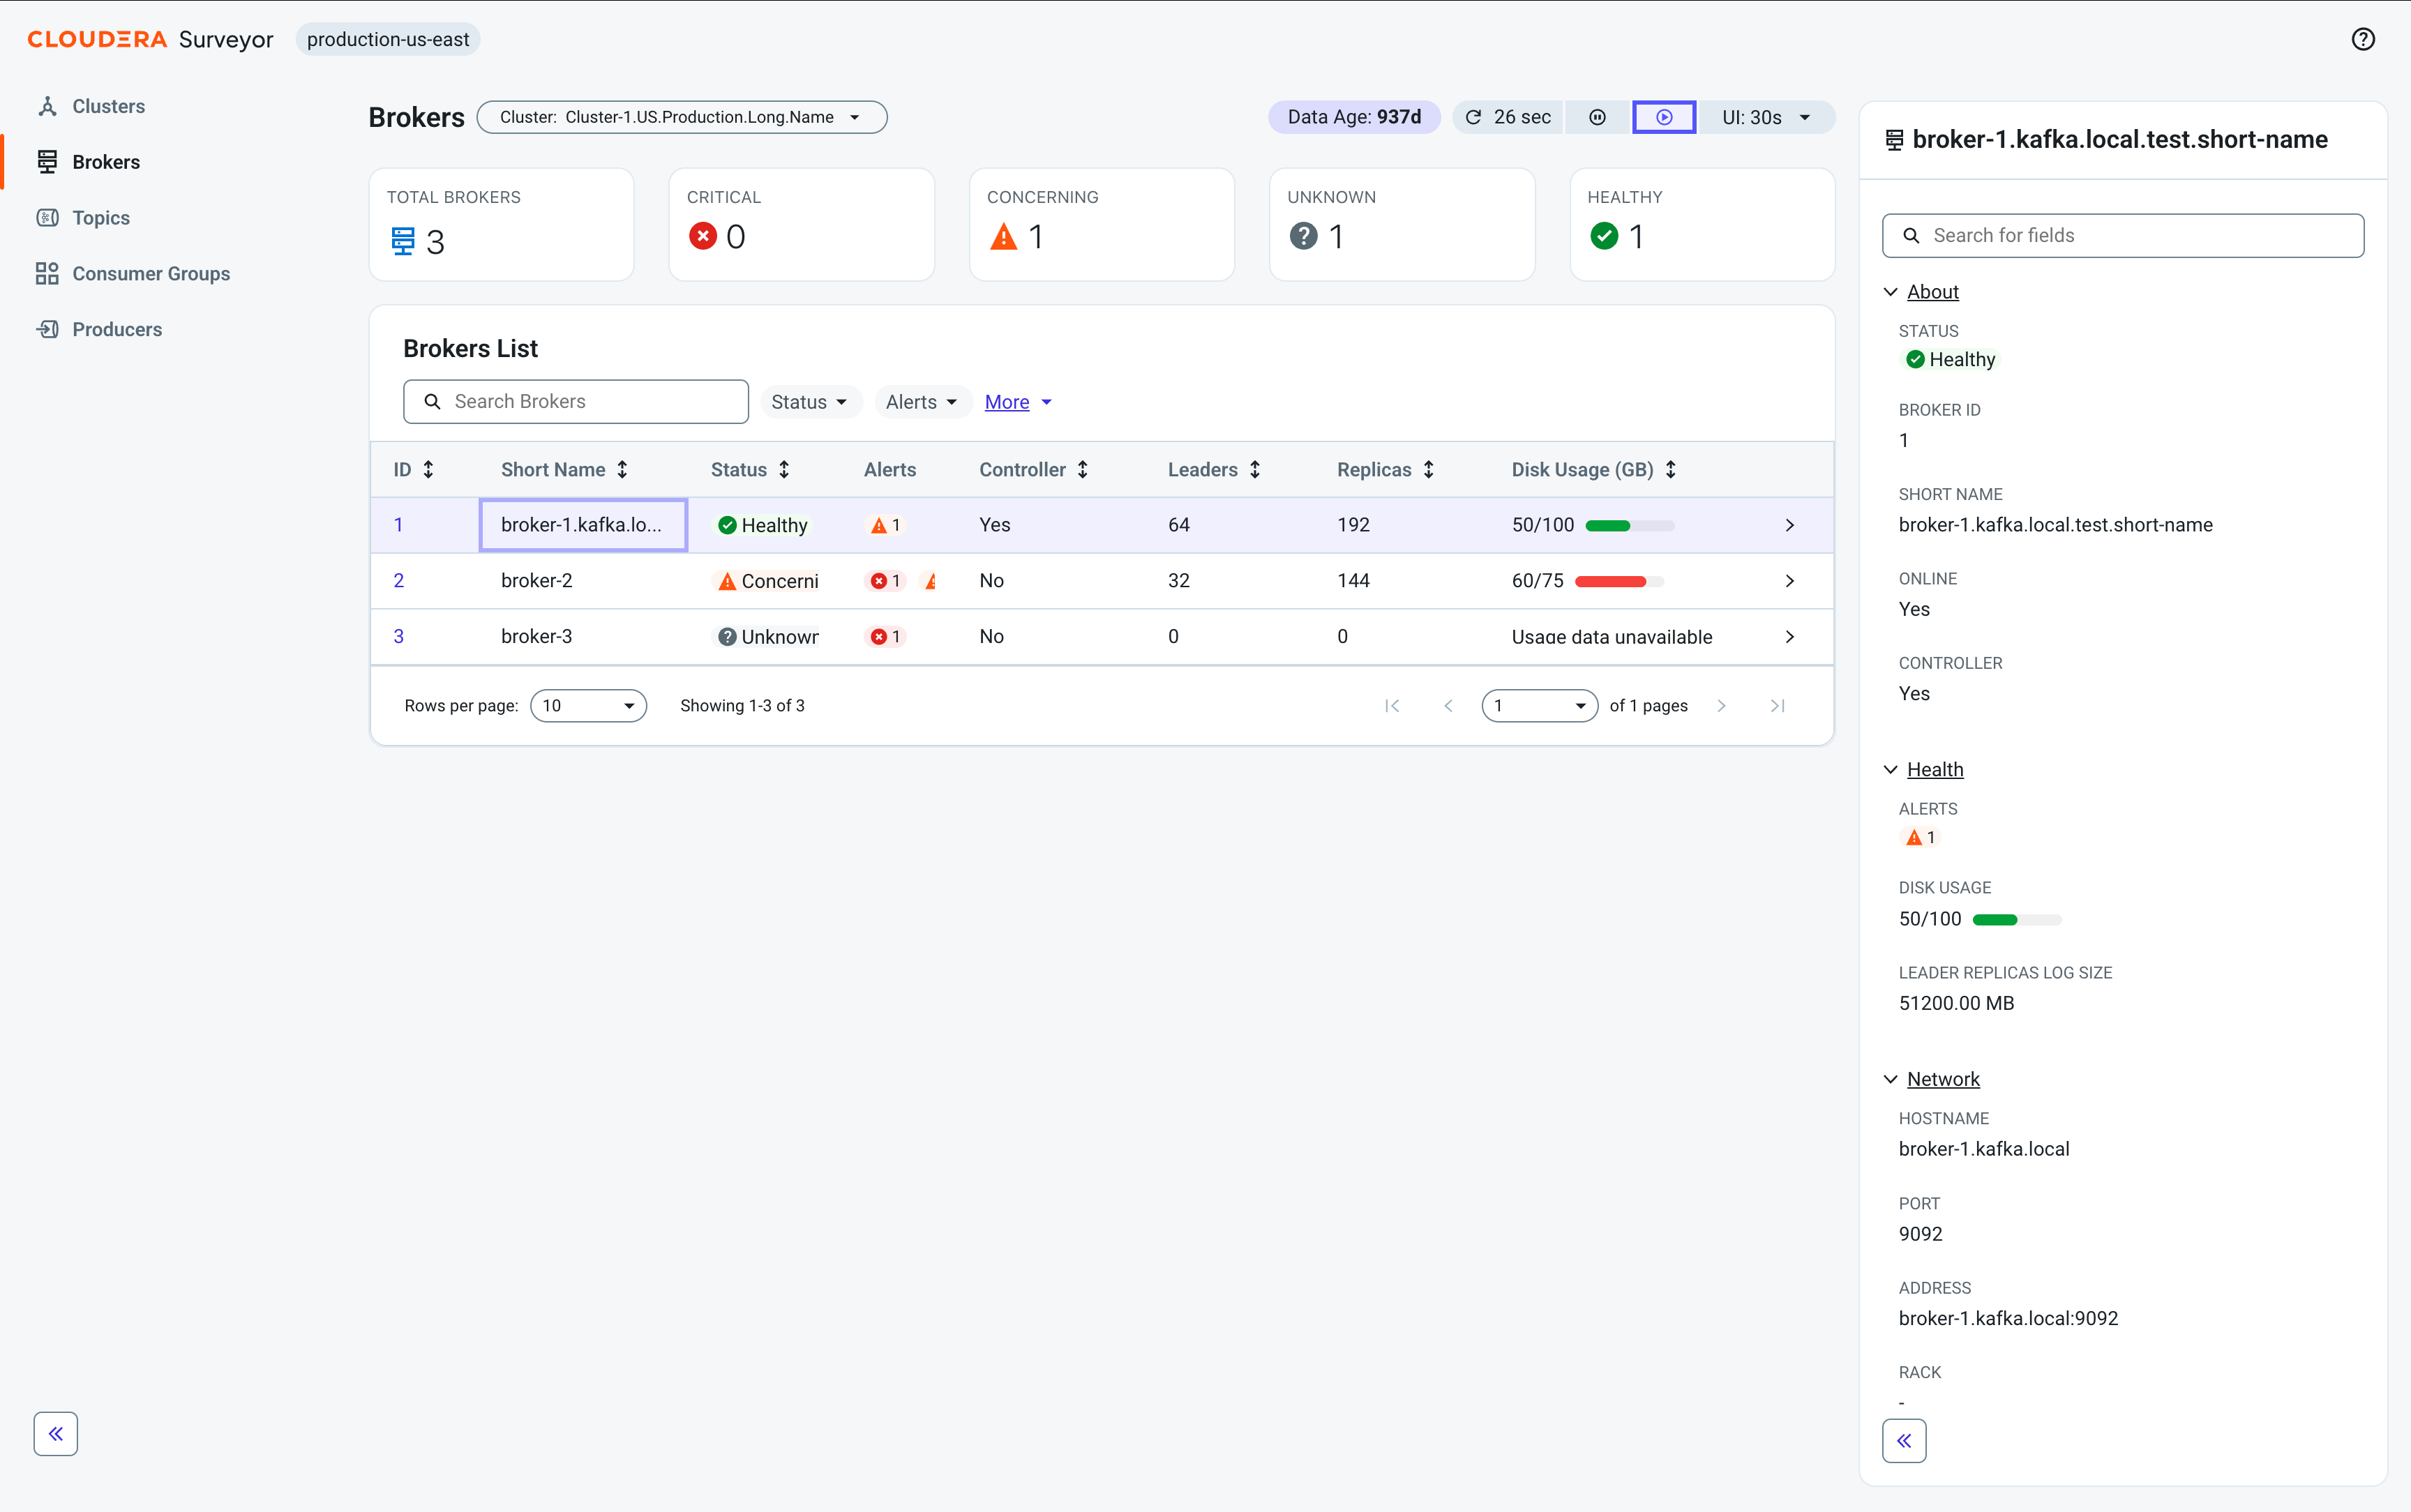
The drawer organizes attributes into named sections that vary by entity type. For example, the Entity Details drawer for brokers has About, Health, Network, and Associated Entities sections. You can expand or collapse each section independently. Use the search field at the top of the drawer to filter attributes by name across all sections. Click any other row to switch the drawer to that entity.
Click the  icon to collapse the drawer to a narrow strip. After you collapse
the drawer, the strip remains visible on the right edge of the page until you navigate away.
The strip displays the name of the selected entity. While the drawer is collapsed,
clicking a row updates the selected entity shown in the strip but does not expand the drawer.
Click the
icon to collapse the drawer to a narrow strip. After you collapse
the drawer, the strip remains visible on the right edge of the page until you navigate away.
The strip displays the name of the selected entity. While the drawer is collapsed,
clicking a row updates the selected entity shown in the strip but does not expand the drawer.
Click the  icon at the bottom of the strip to expand the drawer again.
Alerts
Alerts surface problems detected in your Kafka environment, allowing you to quickly identify and investigate issues across monitored Kafka entities.
Cloudera Surveyor continuously evaluates the state of each monitored Kafka entity during every snapshot. When a condition outside expected bounds is detected, an alert is generated for that entity. Each alert has the following properties:
-
Severity – Indicates the priority of the alert, categorized as
Critical, Concerning, or Unknown. -
Alert type – Identifies the entity type the alert belongs to, such as
 Cluster,
  Broker,
  Topic,
  Partition,
  Log Dir.
 -
Issue type – Describes what was detected.
-
Cause – Provides additional details.
Some alerts are always active by default and require no manual configuration, such as a broker going offline or a partition losing its leader. Other alerts are threshold–based, such as consumer group lag or broker disk usage, and only trigger when thresholds are configured. You can set these thresholds on a per–cluster basis in Cloudera Surveyor configuration. A comprehensive list of active alerts for your environment is available in the Alerts tab on each details page.
Alerts across the UI
-
On overview pages – The Status column reflects each entity's health based on its alerts, and the Alerts quick filter lets you filter the table to display only entities with alerts of a specific severity.
-
On details pages – An alert summary is displayed at the top of the page with the count of active alerts by severity. A dedicated Alerts tab provides the full list of alerts for that entity, including alerts from its child entities.
- On individual fields in tables and the Entity Details drawer – Alert indicators appear inline next to specific data values displaying when a particular metric has an issue.
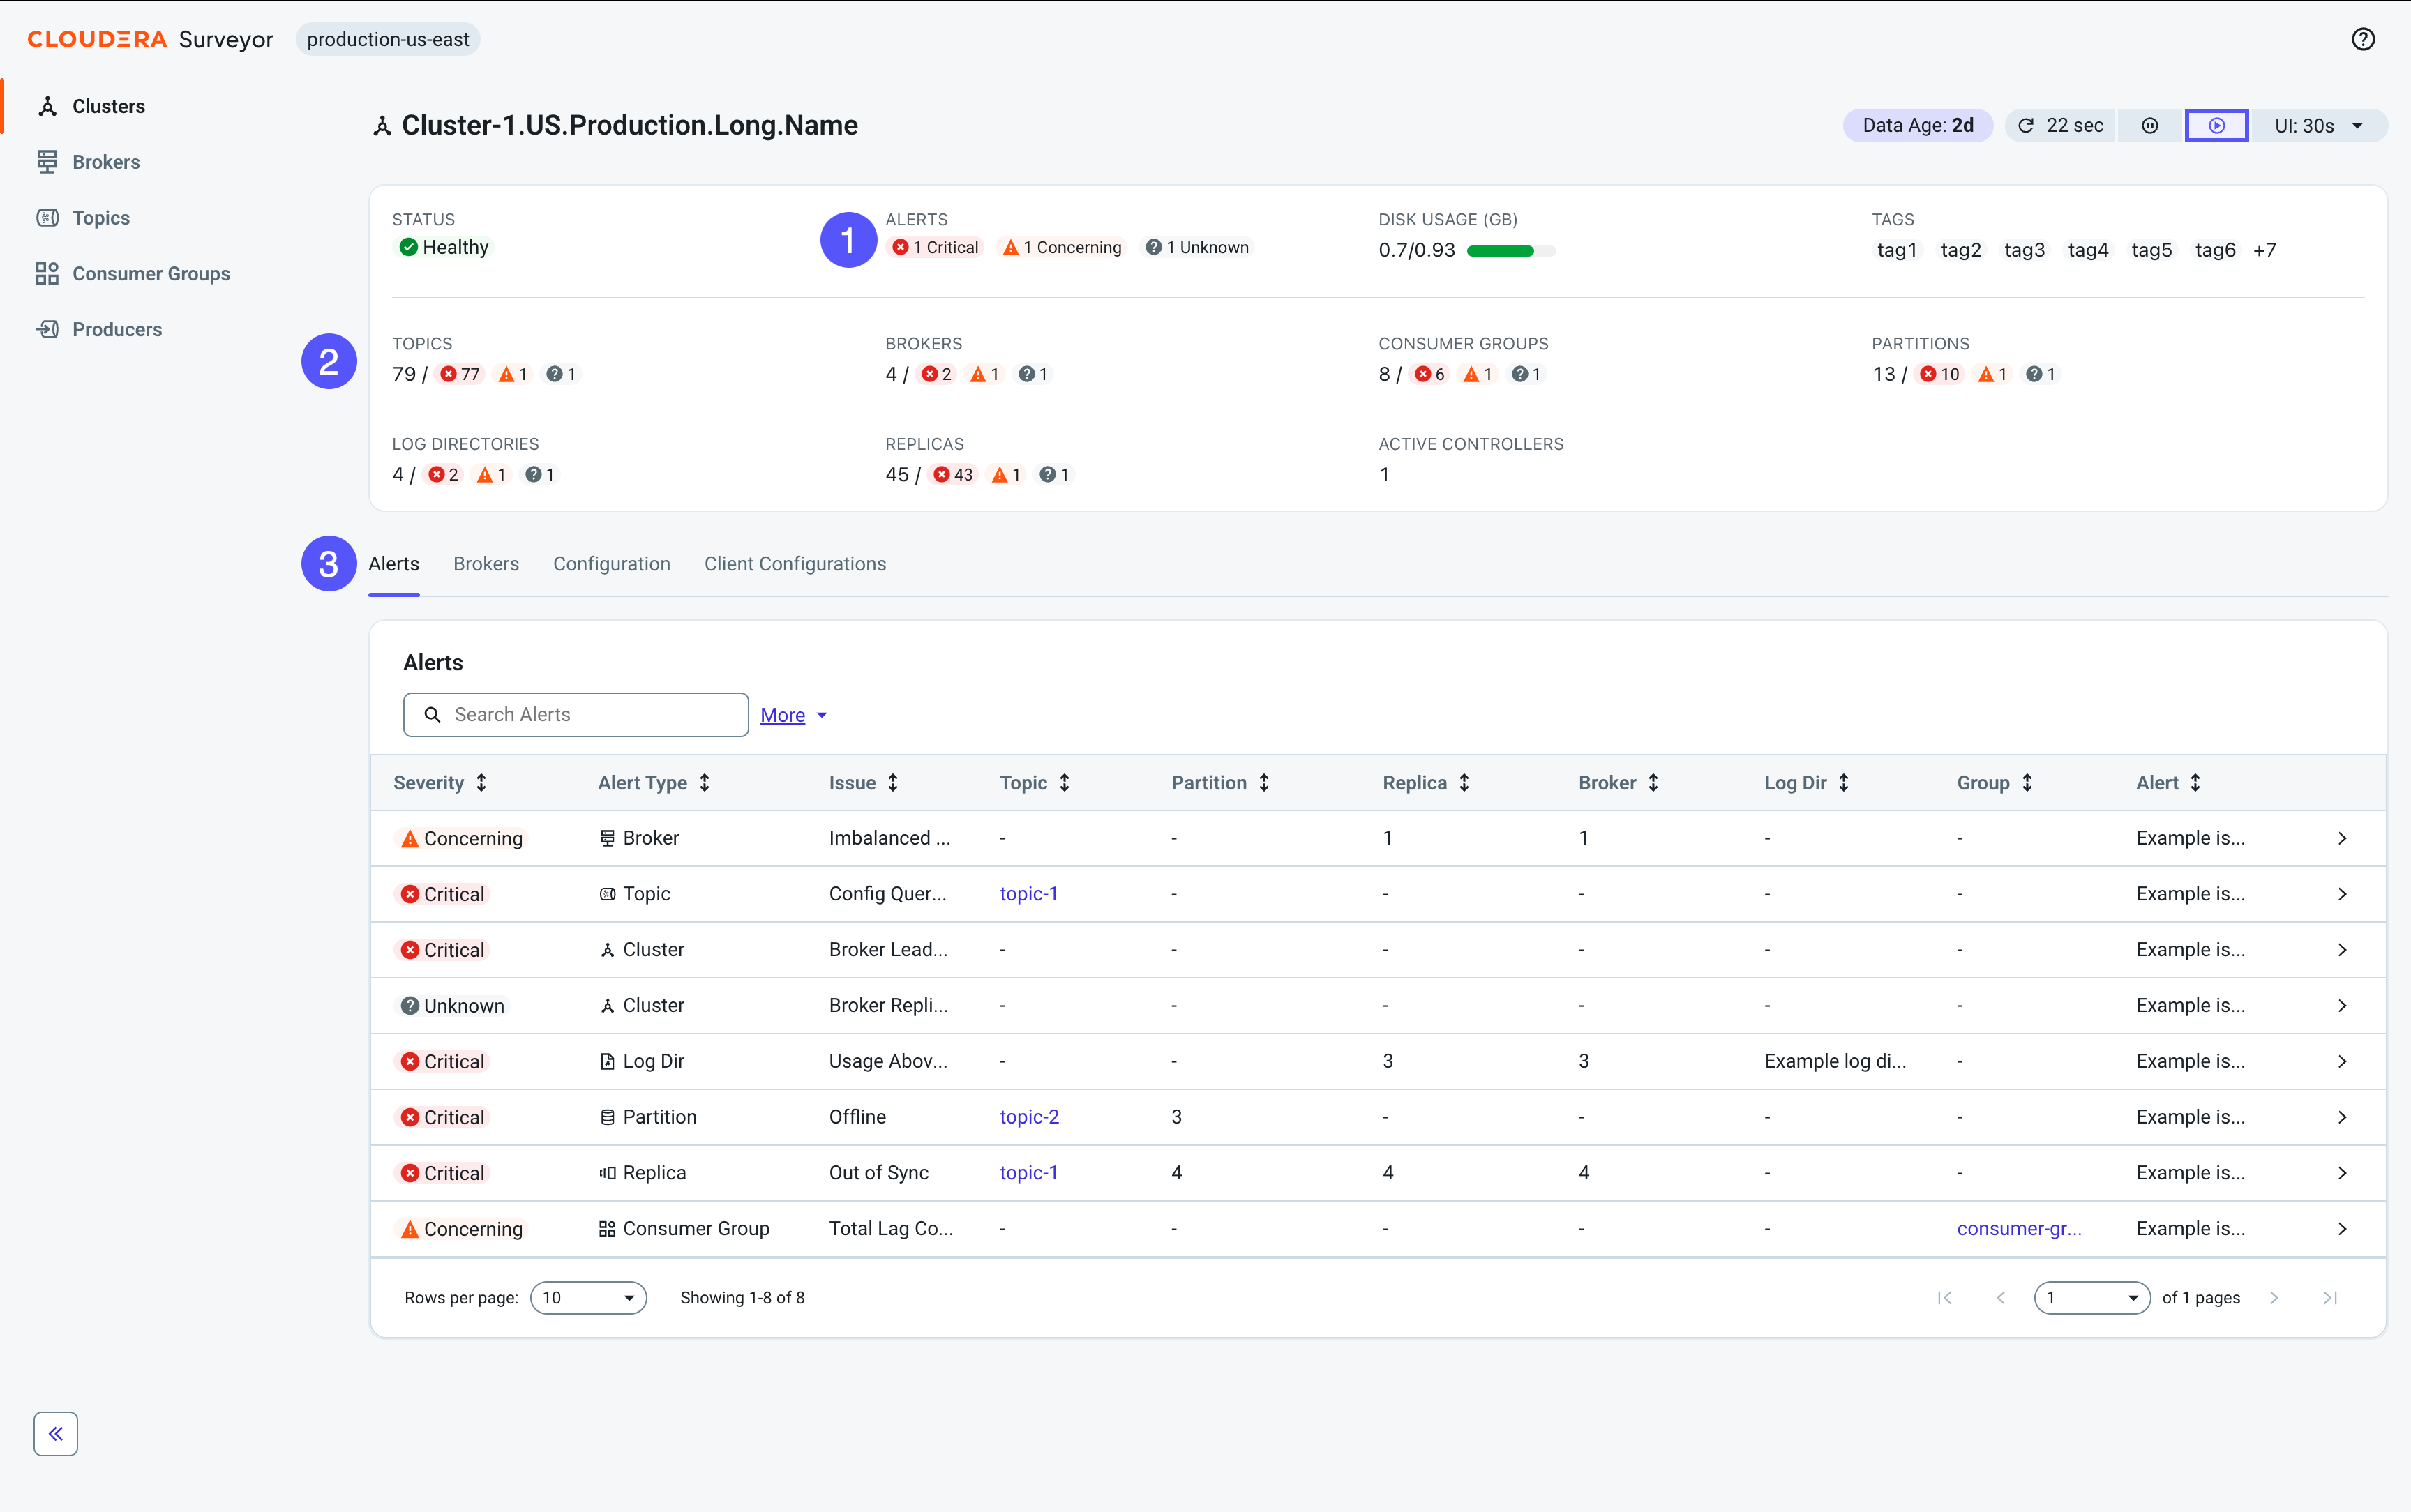
-
Alert summary displays the total count of alerts by severity for this cluster and all its child entities.
-
Child entity summaries display the total count and status distribution of child entities.
-
The Alerts tab displays the full list of all alerts with detailed information including severity, alert type, issue type, affected entities, and cause messages.
Alerts on individual fields
Alerts appear as inline indicators next to individual data fields throughout the UI, making problems visible at a glance wherever the affected data is displayed.
When Cloudera Surveyor detects a problem, it surfaces inline indicators on the affected fields. These indicators surface alerts that are also tracked in the Alerts tab. This visibility ensures you can quickly spot problems while scanning tables or viewing entity details, without navigating to the Alerts tab. These indicators are displayed as icons alongside field values in tables, detail pages, and the Entity Details drawer.
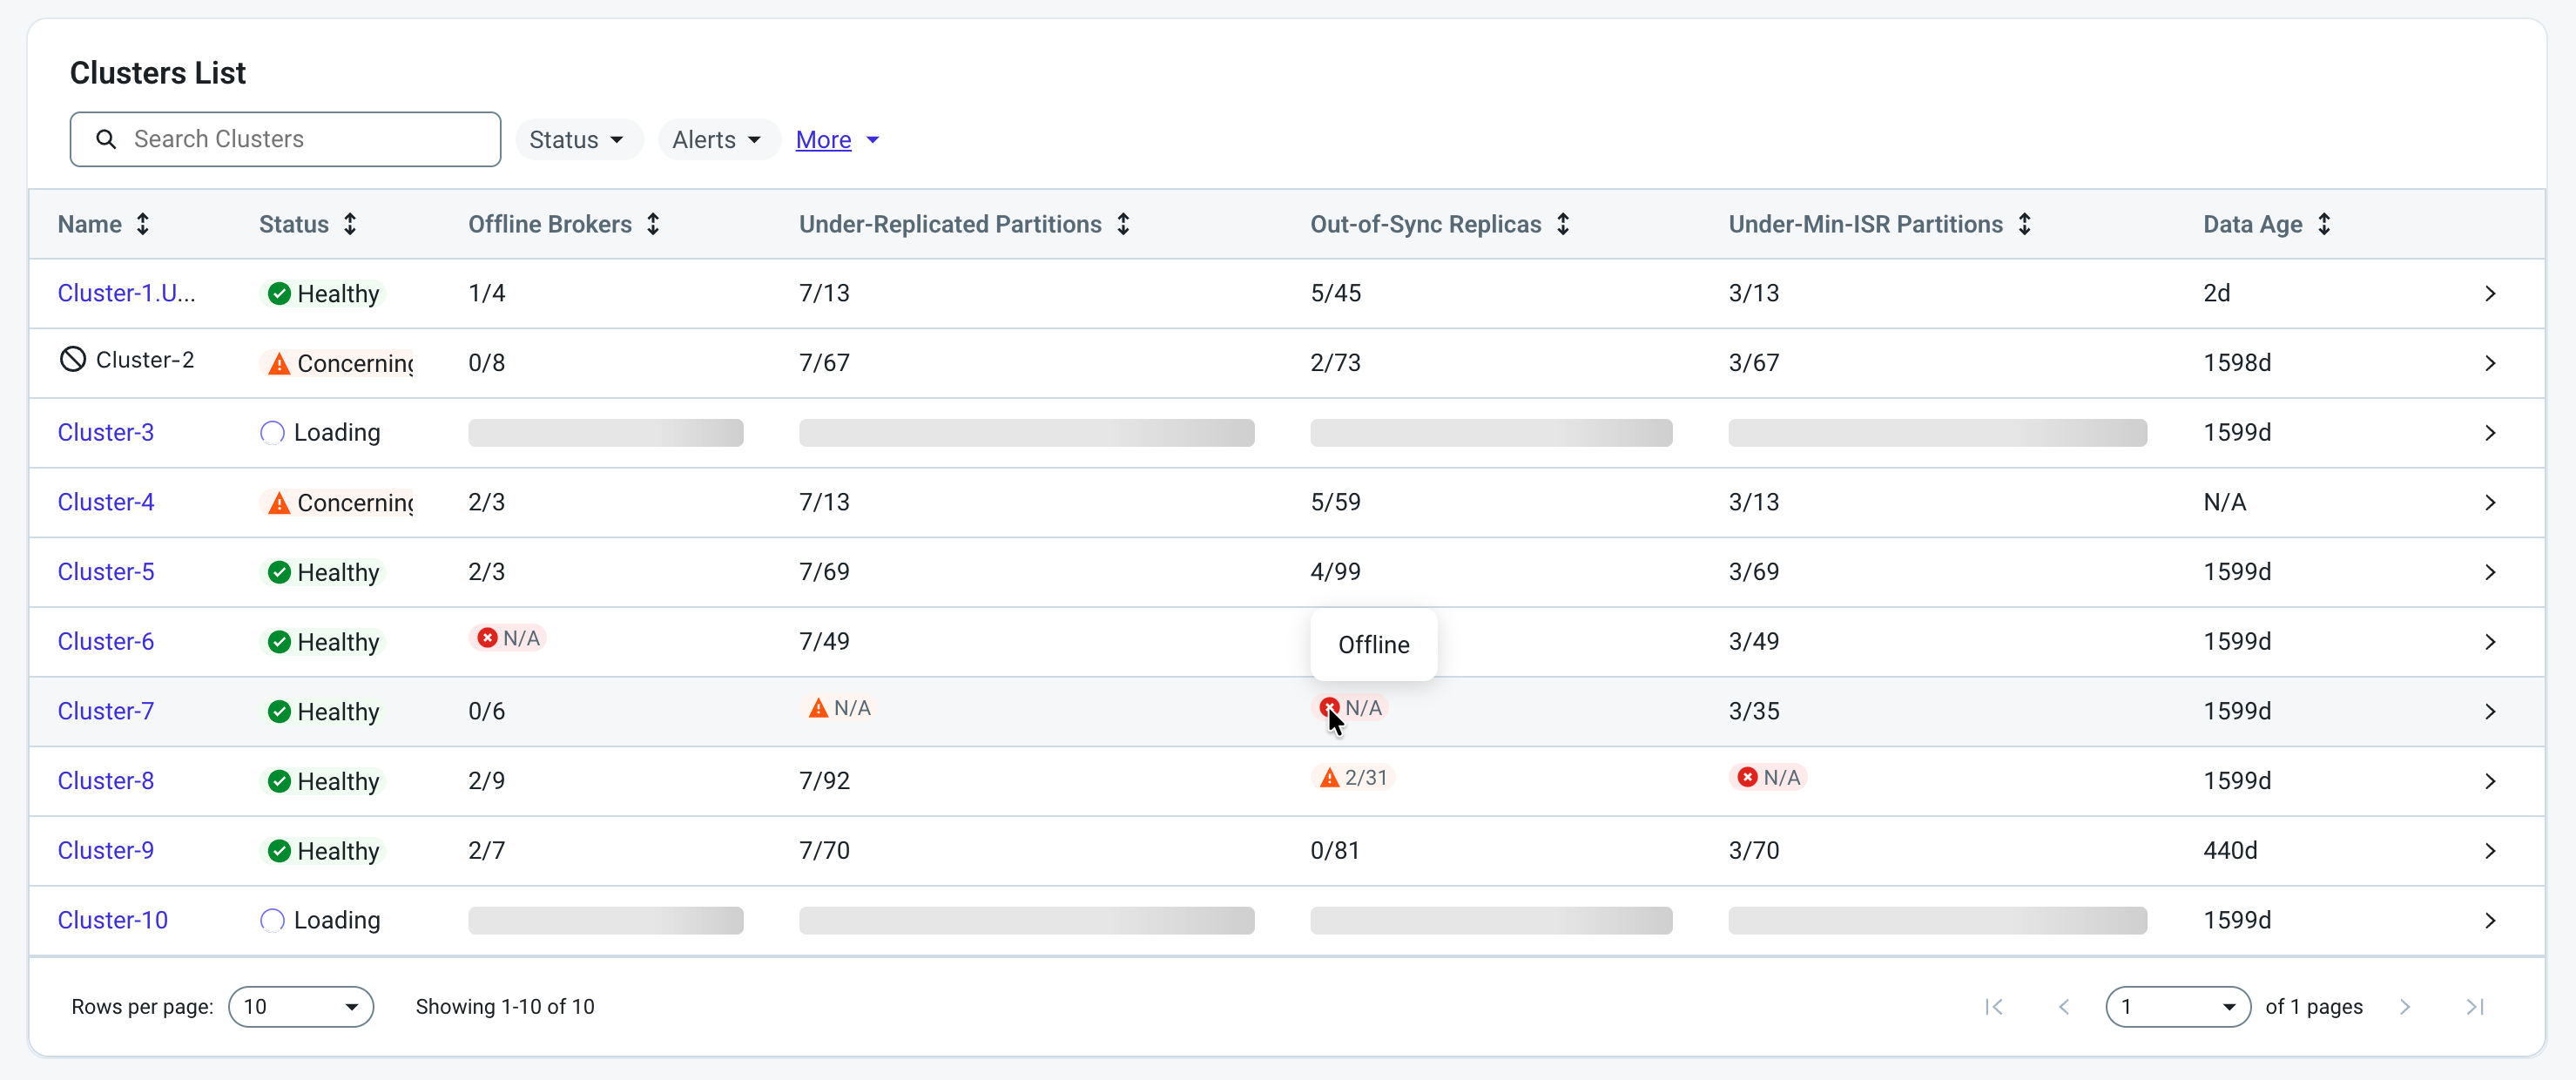
The following examples represent common field-level issues detected within your Kafka environment:
-
Replication factors below the recommended minimum
-
In–sync replica counts that do not match expectations
-
Consumer group lag exceeding thresholds
-
Partition sync states indicating offline replicas
Data refresh on the UI
Data refresh controls throughout the Cloudera Surveyor UI enable you to manage data update frequency, and provide information on how fresh the data is.
Data refresh controls
The Cloudera Surveyor UI includes various data refresh control options. These provide information on how recently the data was published in the UI, how old the latest snapshot is, and allow you to control UI update frequency. These controls do not offer a way to configure the snapshot interval or offer a way to trigger a new snapshot on-demand.
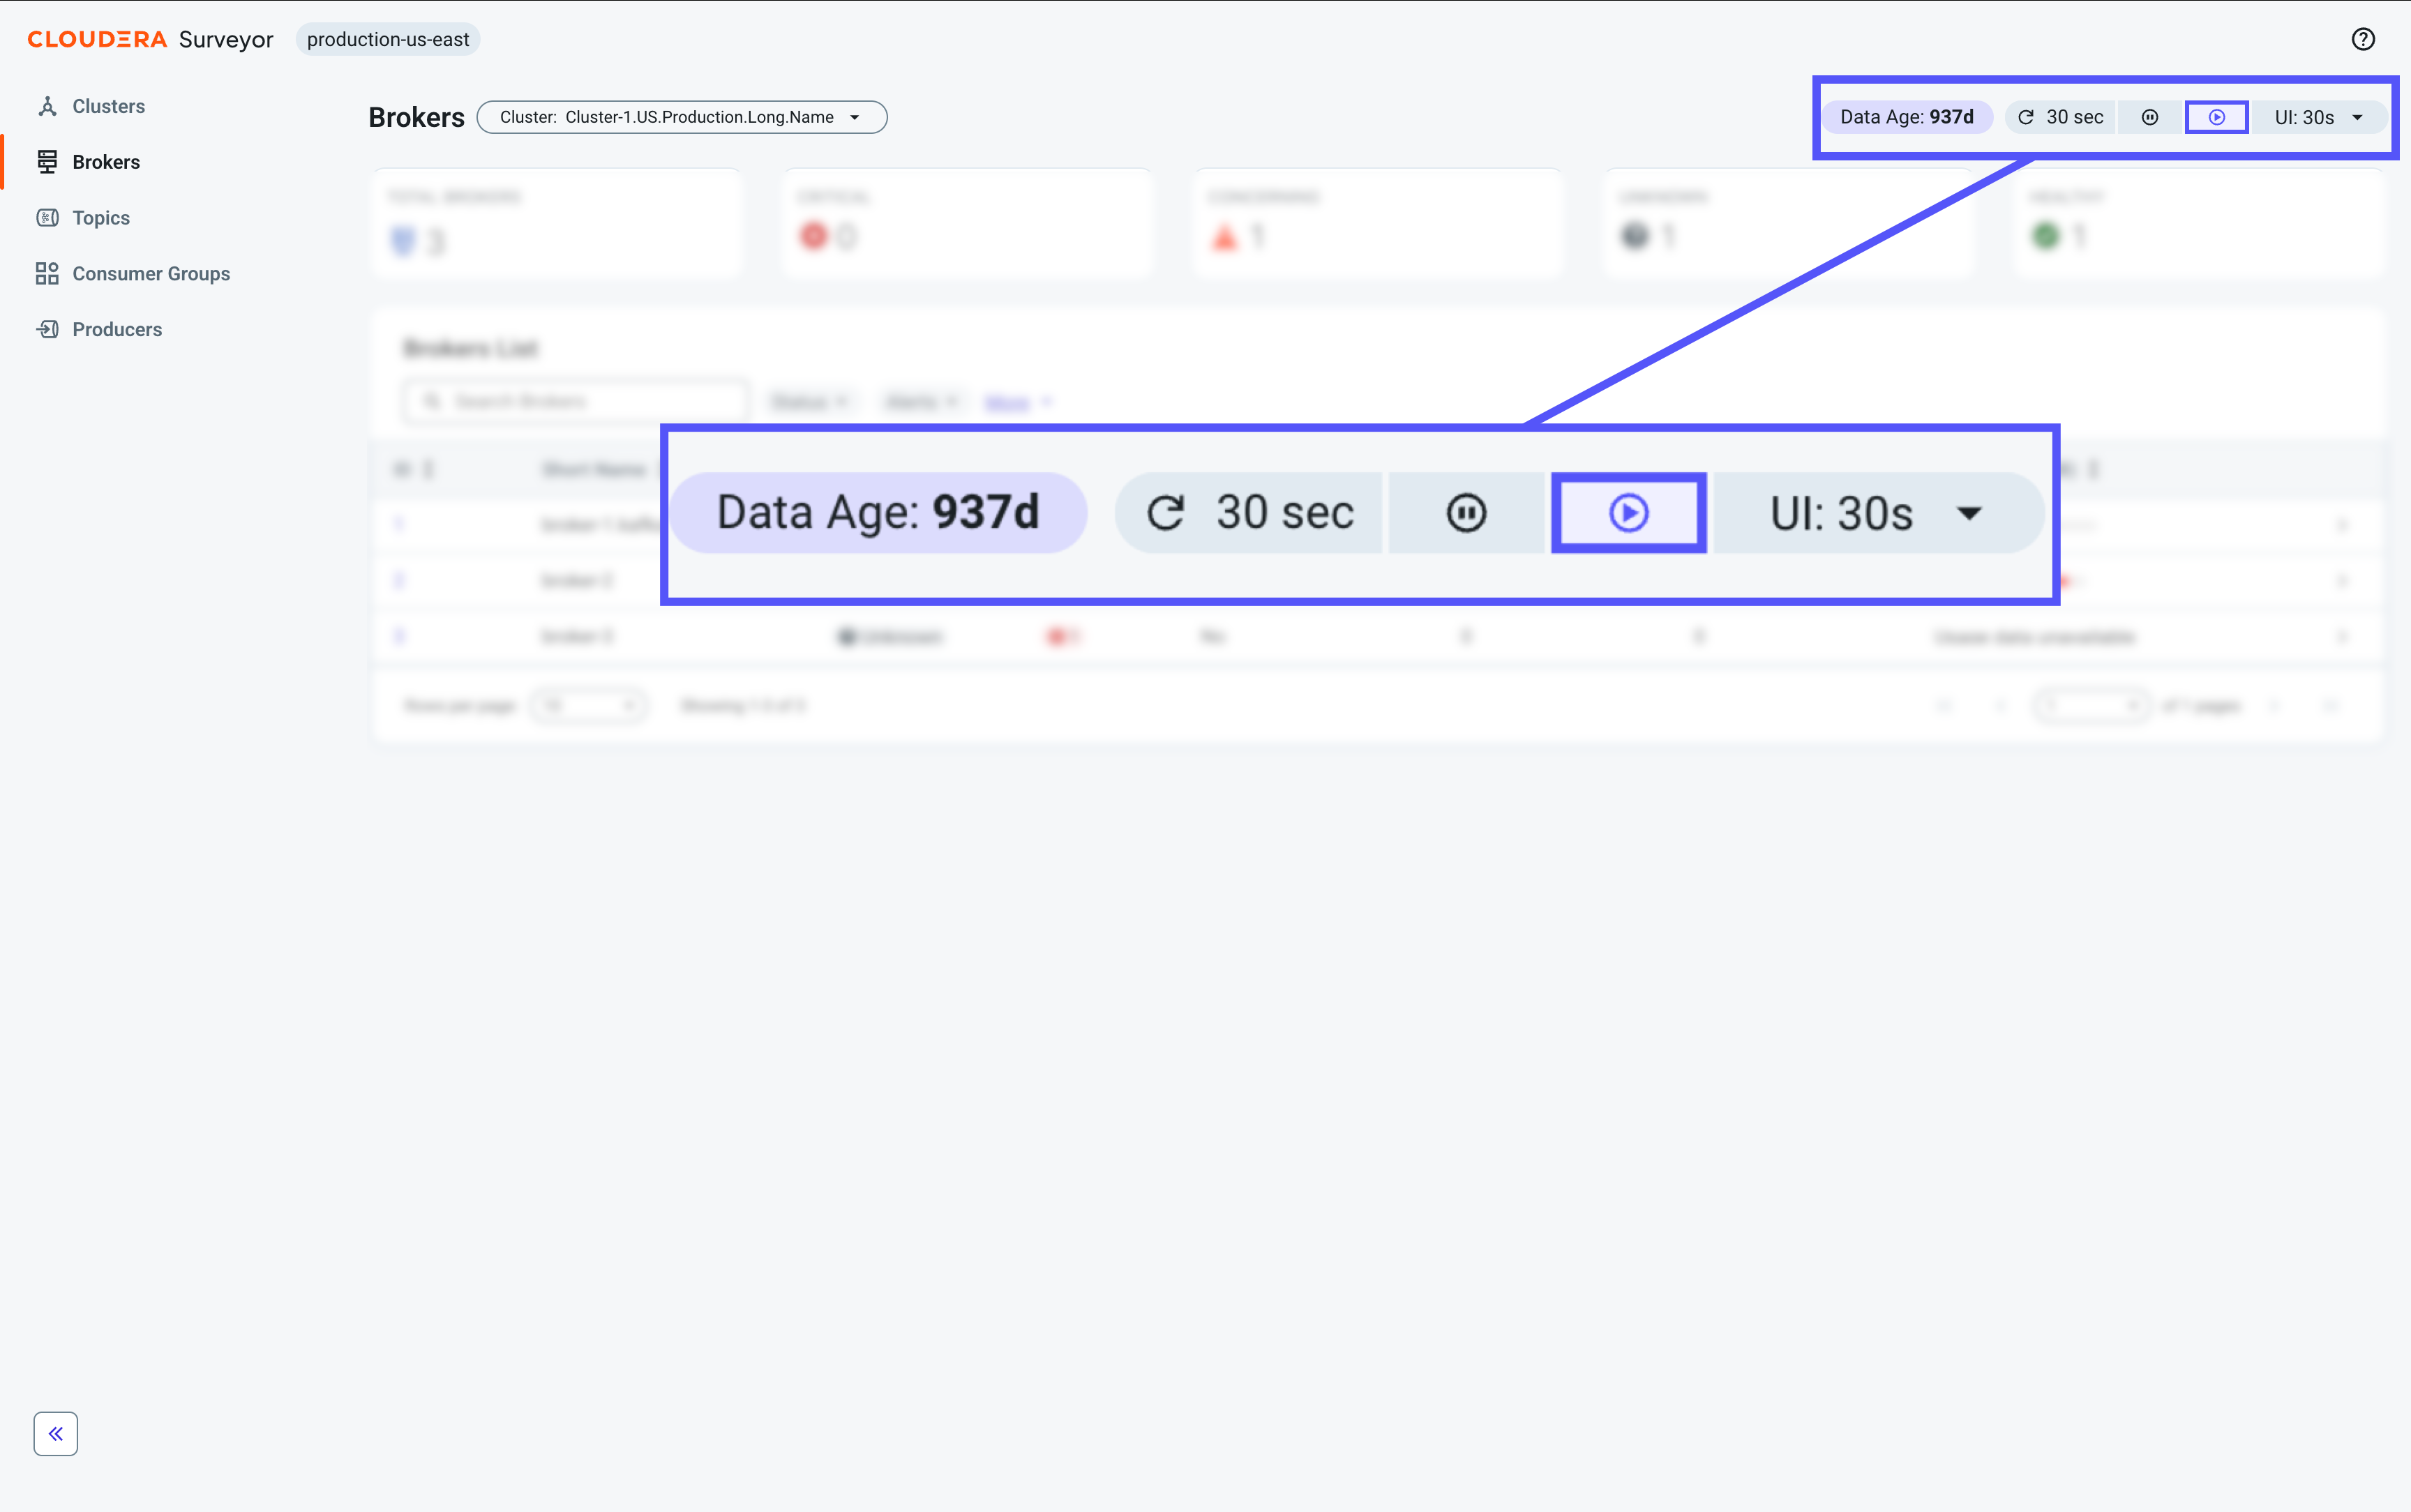
-
Data Age: [TIME] – Snapshot time counter. Displays the time since Cloudera Surveyor took a snapshot of the Kafka cluster. Snapshots are taken automatically at preconfigured intervals.
-
 [TIME] – Refresh timer and
button. Displays the time until next automatic refresh to display latest
snapshot data. Click to refresh the UI and display latest available
snapshot data on-demand. Does not trigger a new Kafka snapshot.
[TIME] – Refresh timer and
button. Displays the time until next automatic refresh to display latest
snapshot data. Click to refresh the UI and display latest available
snapshot data on-demand. Does not trigger a new Kafka snapshot. -
 /
/  – Pause and resume buttons for automatic refresh.
 -
UI: [TIME] – Dropdown that sets the automatic refresh frequency for displaying snapshot data.
Data flow example
This examples shows a scenario in which snapshots are taken every 10 minutes:
- Minute 0: Cloudera Surveyor takes a snapshot of the Kafka cluster
- Minute 0-10:
- Data Age: [TIME] counter starts at 0 and counts up to 10 minutes.
- The snapshot data is published on the UI either automatically with the
next automatic refresh or when you click the [TIME] button.
- Changes in Kafka that happened after the snapshot was taken are not visible.
- Minute 10:
- Cloudera Surveyor takes the next snapshot.
- Data Age: [TIME] resets to 0.
- Minute 10+: After the next UI refresh, data from the new snapshot is displayed, including the most recent Kafka changes.