Monitoring SQL results and jobs
You can check your SQL query results and monitor your SQL jobs with Streaming SQL Console, Flink Dashboard and Streams Messaging Manager.
Sampling results in Streaming SQL Console
You can sample data from a running job to the Streaming SQL Console without writing it to any sink to inspect the data and to make sure the job is running correctly, and producing the results you expect.
Sampling the results to your browser allows you to inspect the queried data and iterate on your query. You can sample 100 rows in the Results tab under the SQL Editor on the jobs page. Even if you do not specify any sink to the SQL job, the results automatically appear in the Results tab.

Reviewing data in Streams Messaging Manager
When you create a job that sends results to a Kafka sink, you can review if the results are being written out to the Kafka topic using Streams Messaging Manager.
Without stopping the previously started job that writes results from the summaries table,
access the Streams Messaging Manager user interface from your browser:
http://localhost:9991/#/topics
On the Streams Messaging Manager user interface, navigate to Topics and search for the previously created Kafka topic: mytopic.
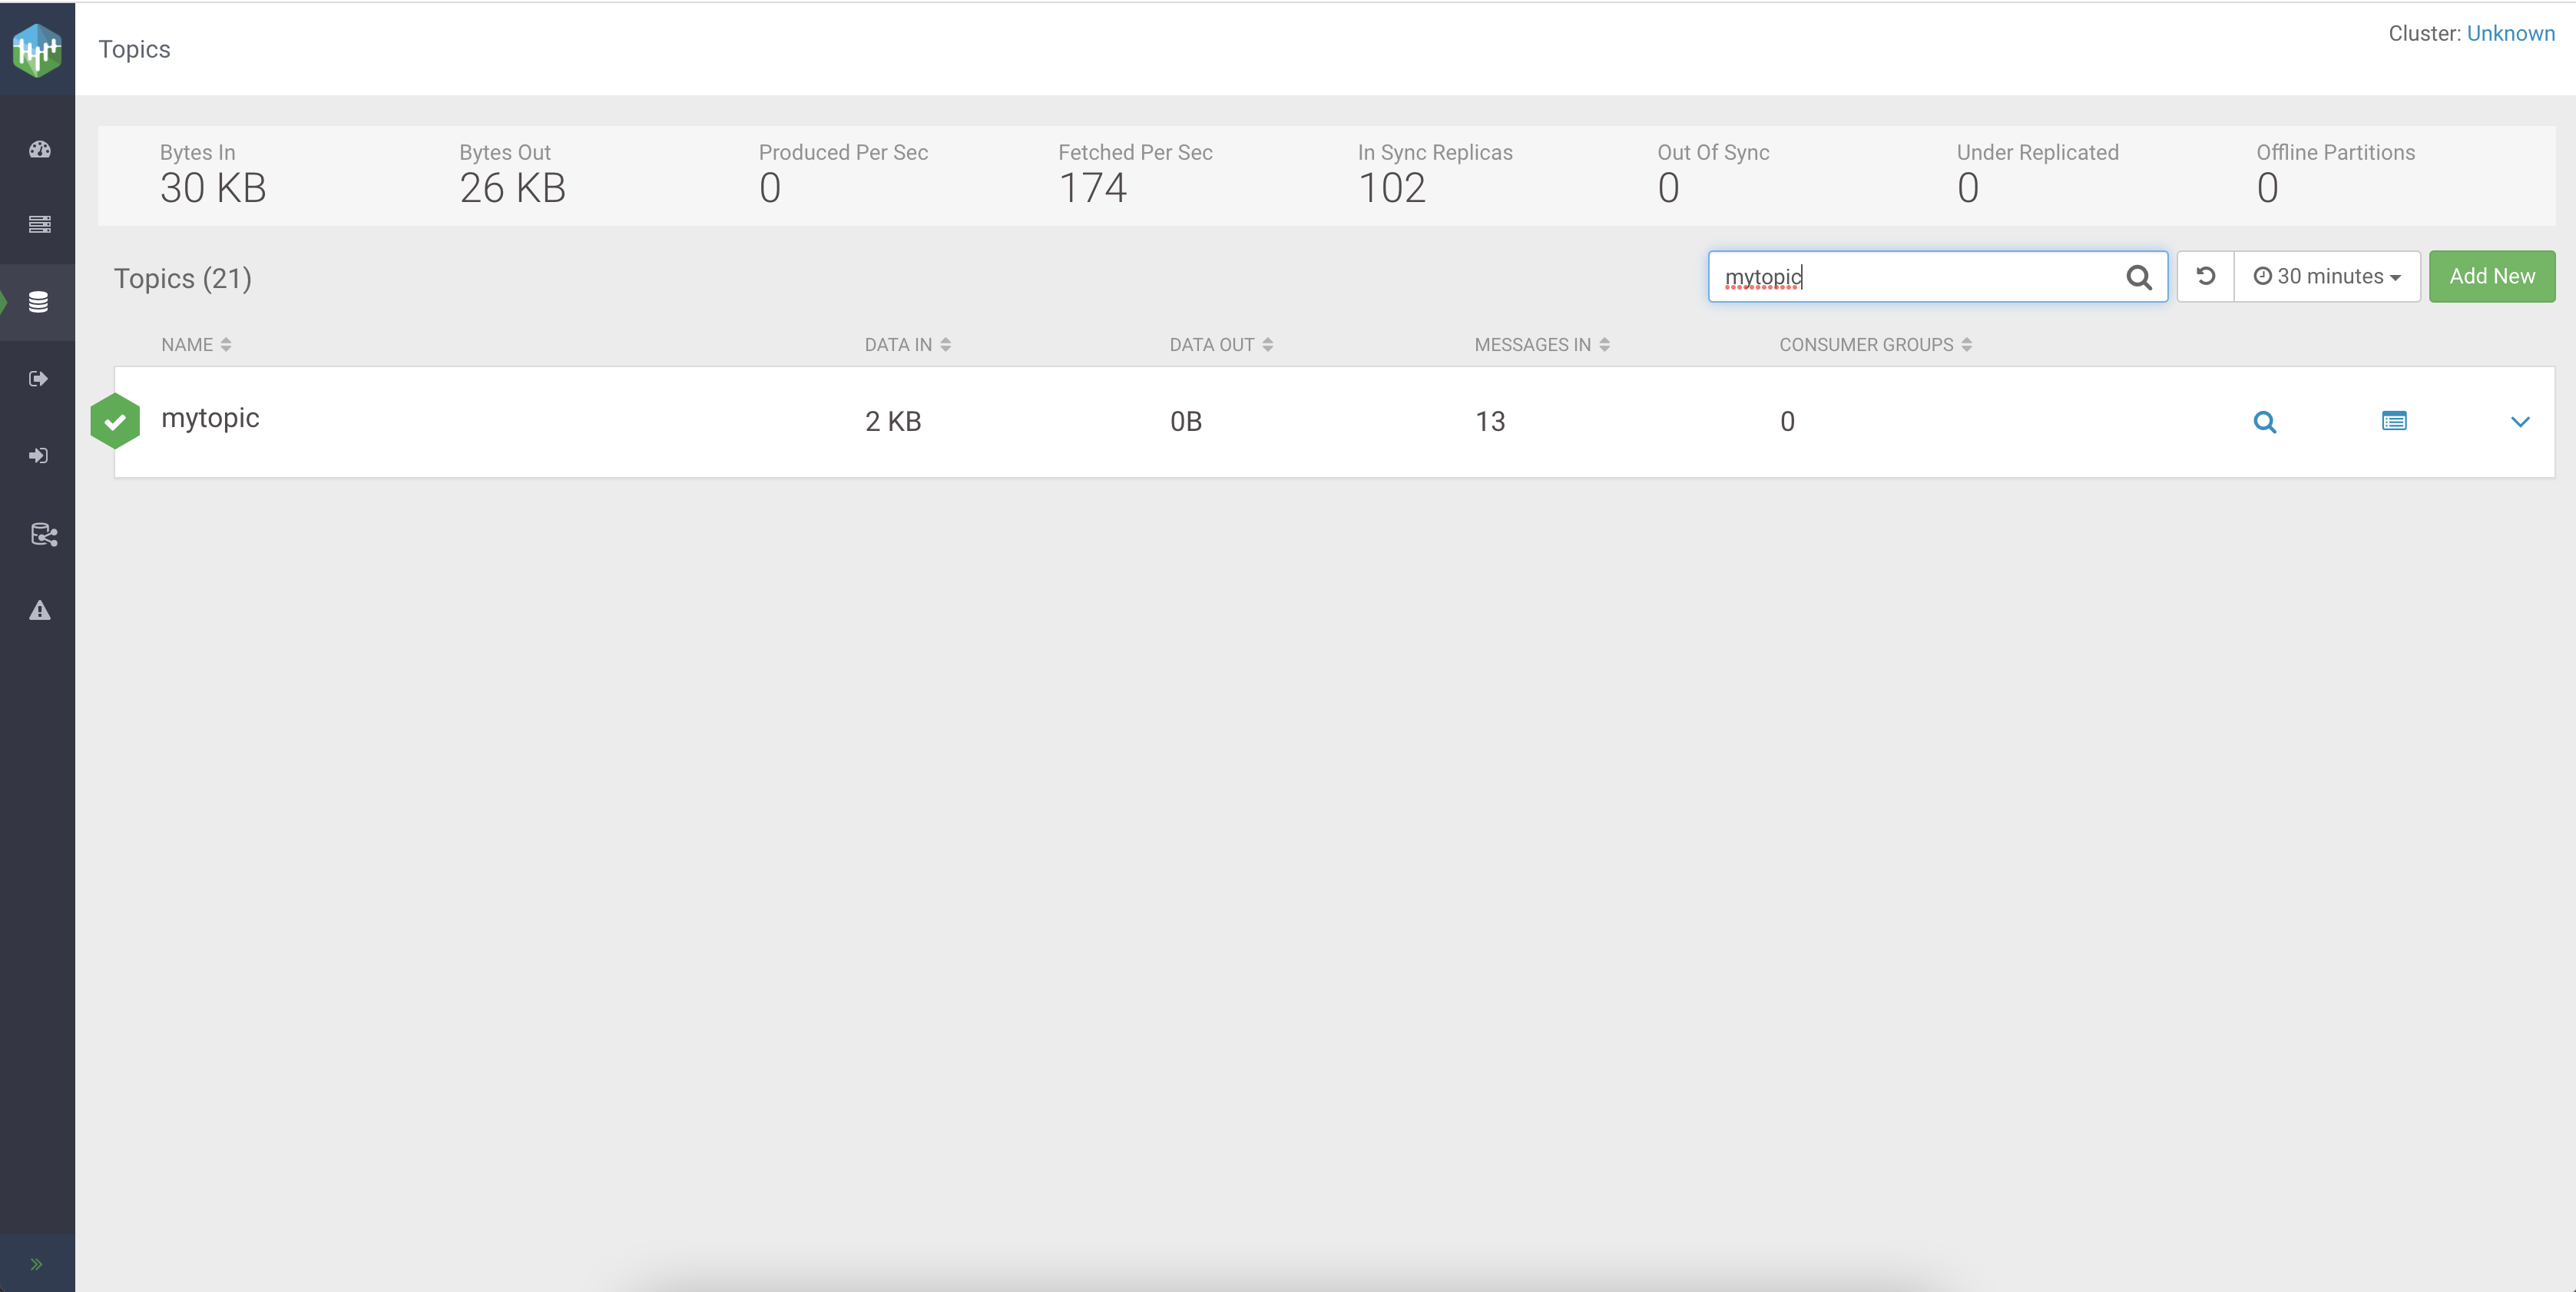
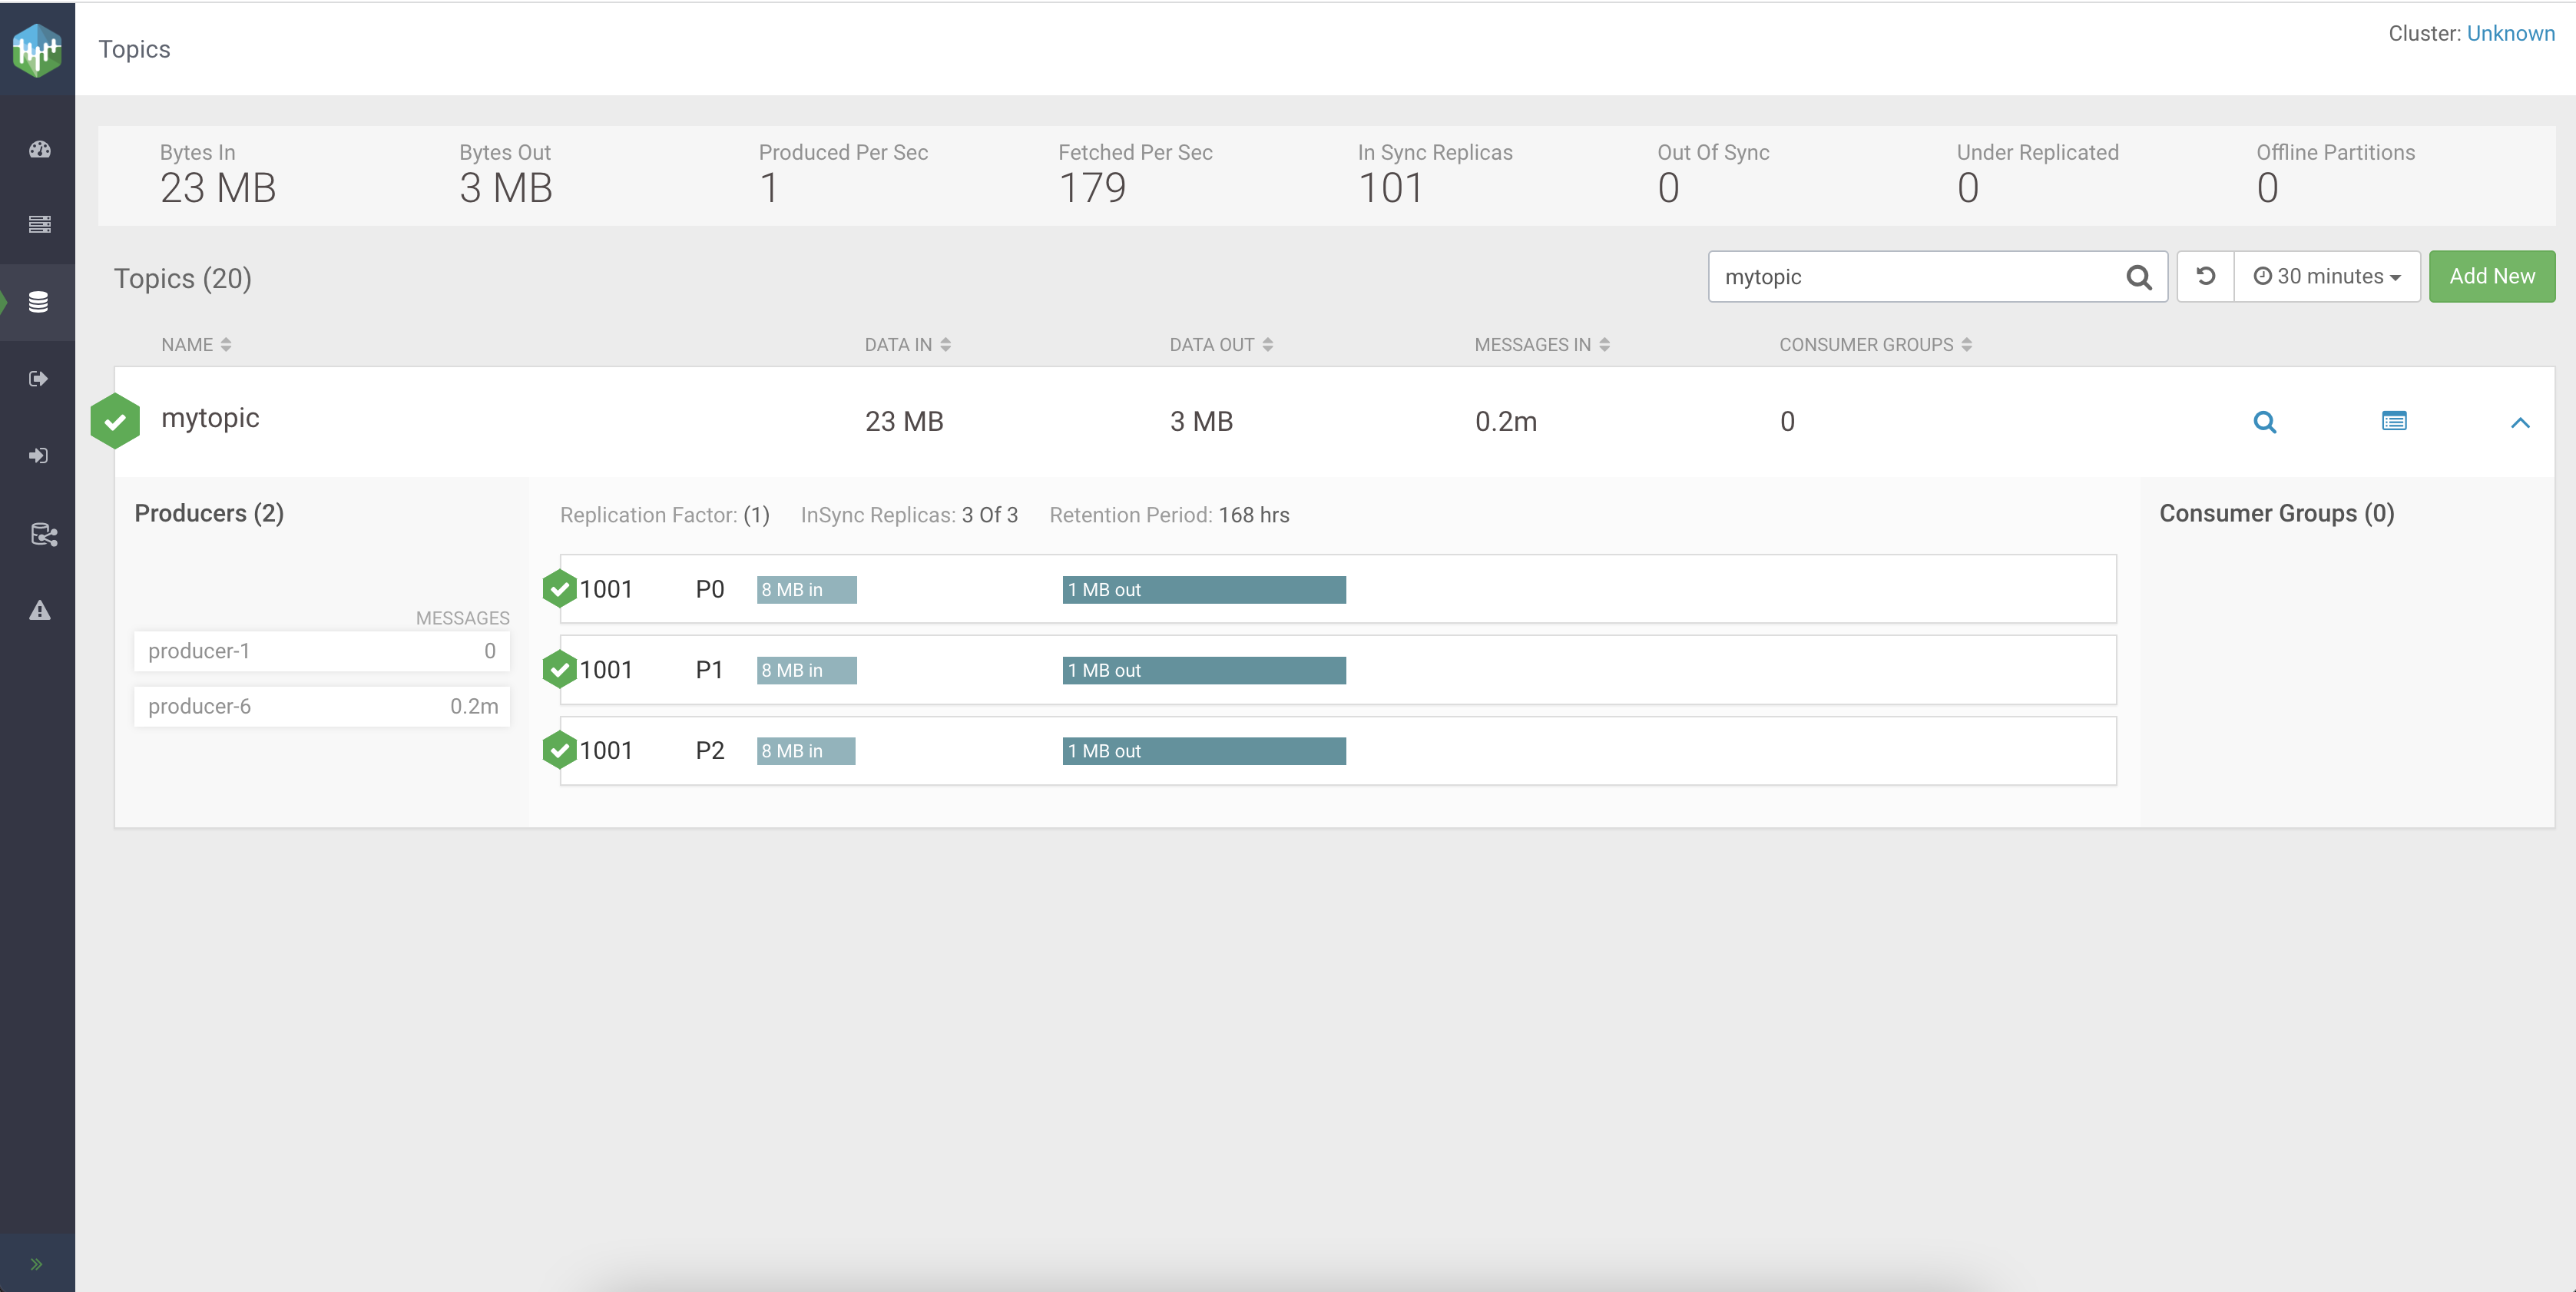
When the mytopic shows up, you can already see that there are messages already in the topic. However, you can further look into the topic by clicking on the entry to see more details about the producers and messages.
Reviewing jobs in Flink Dashboard
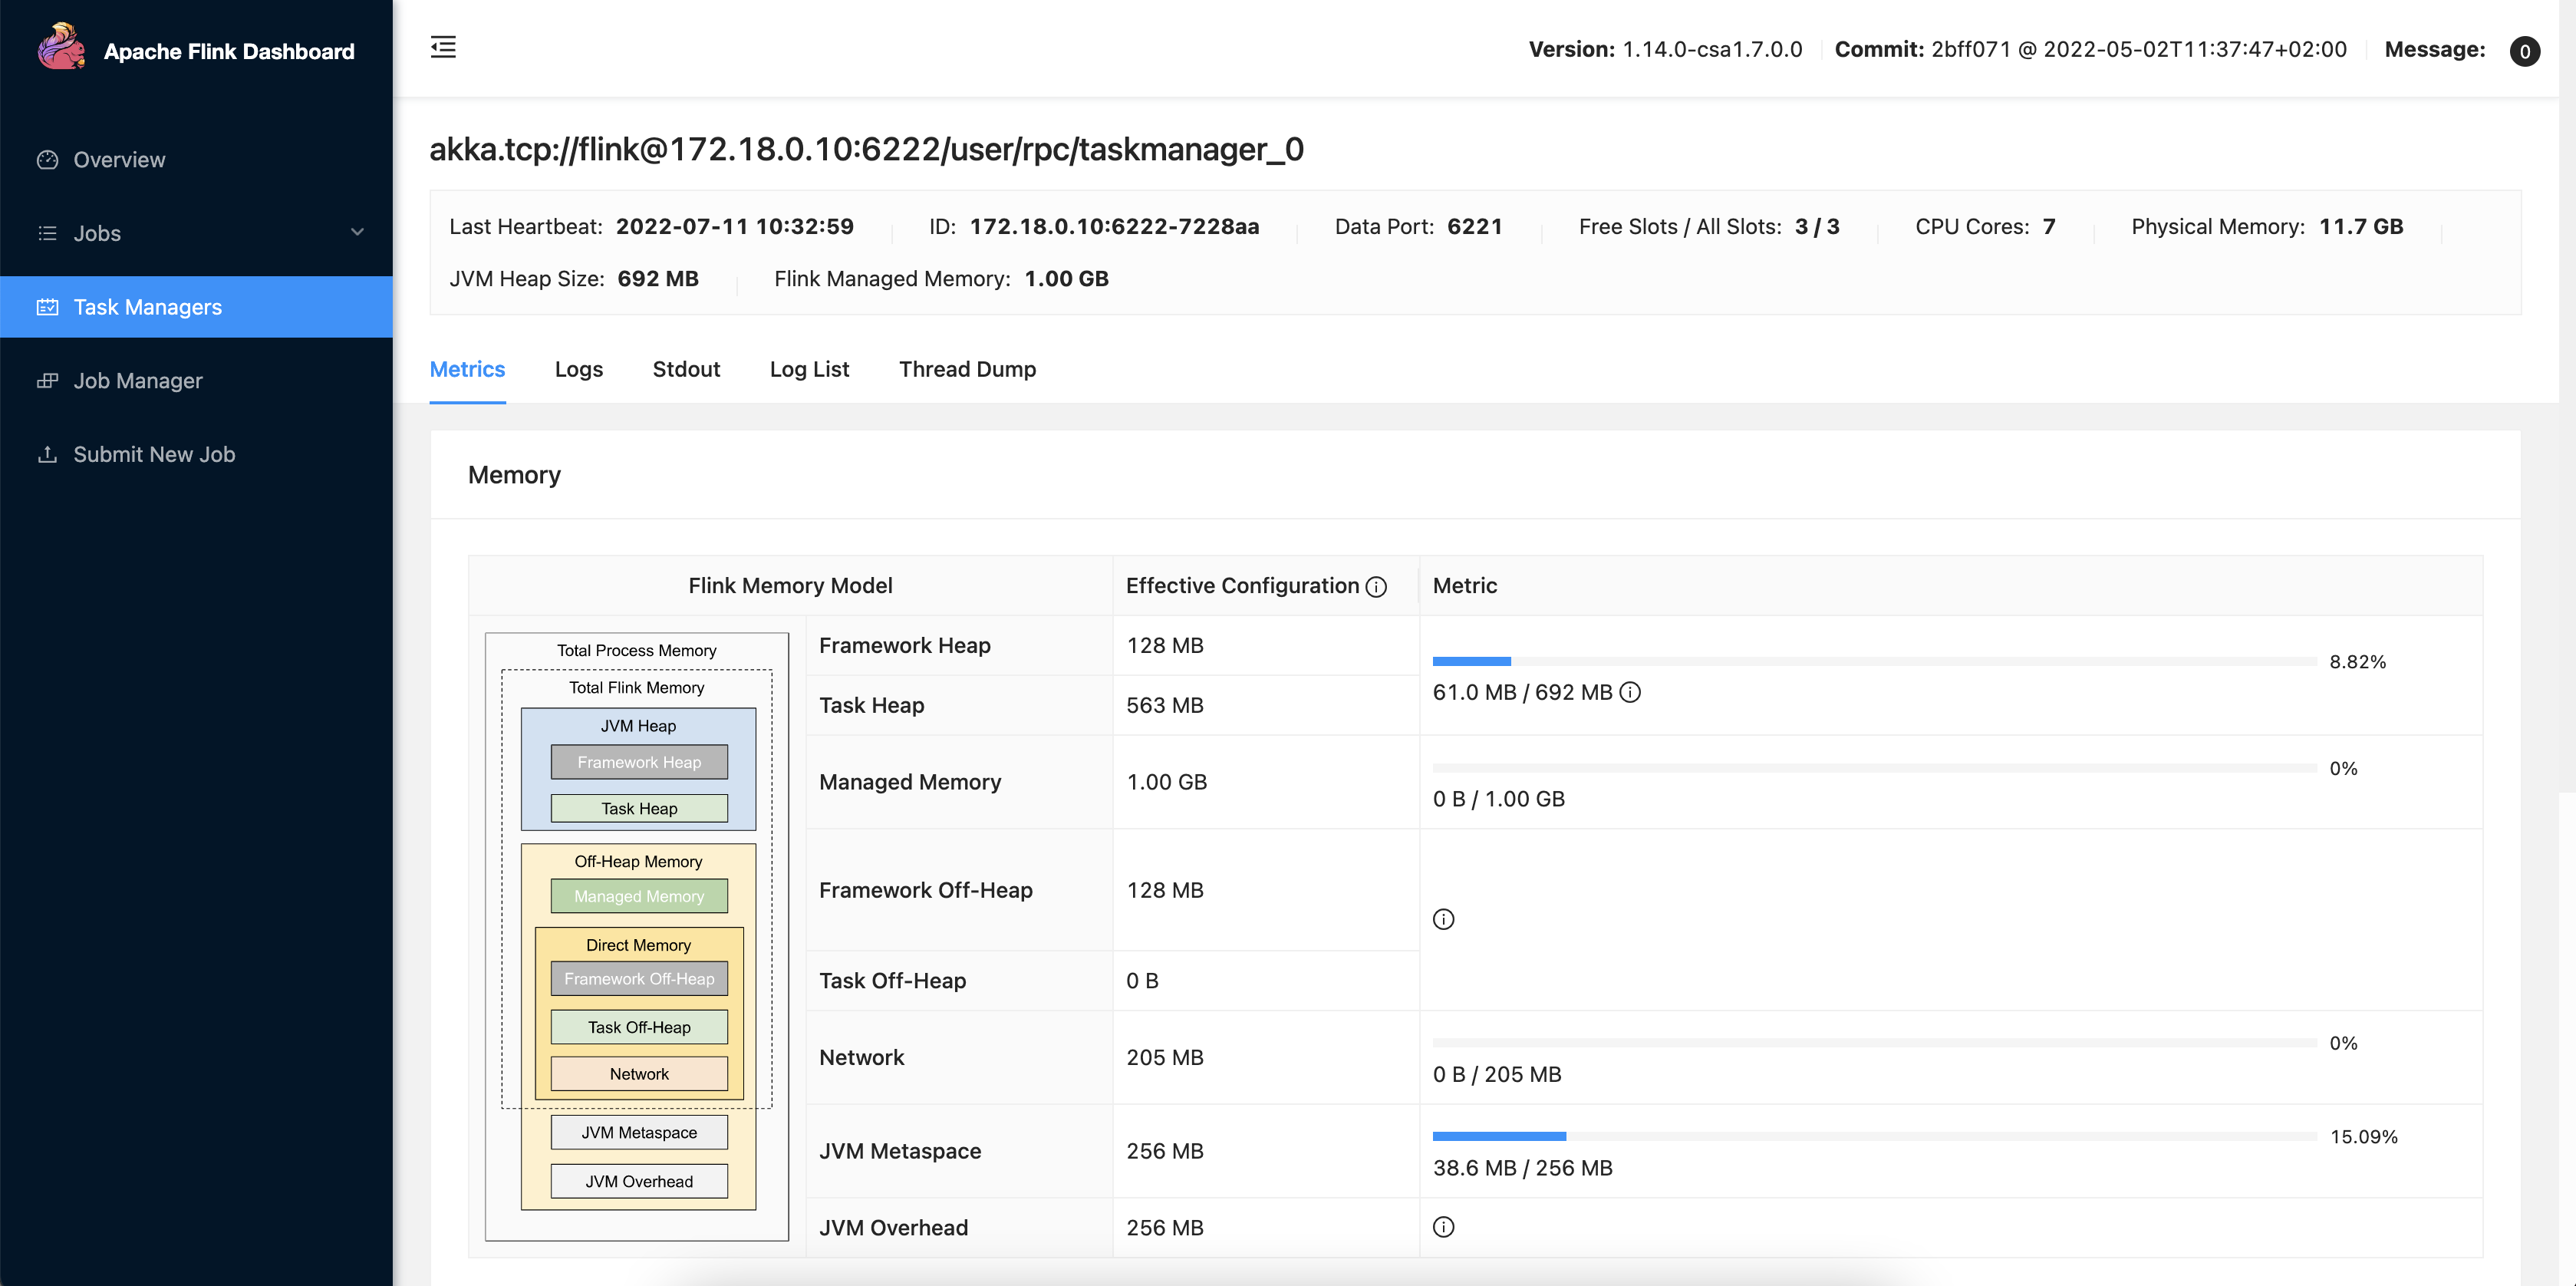
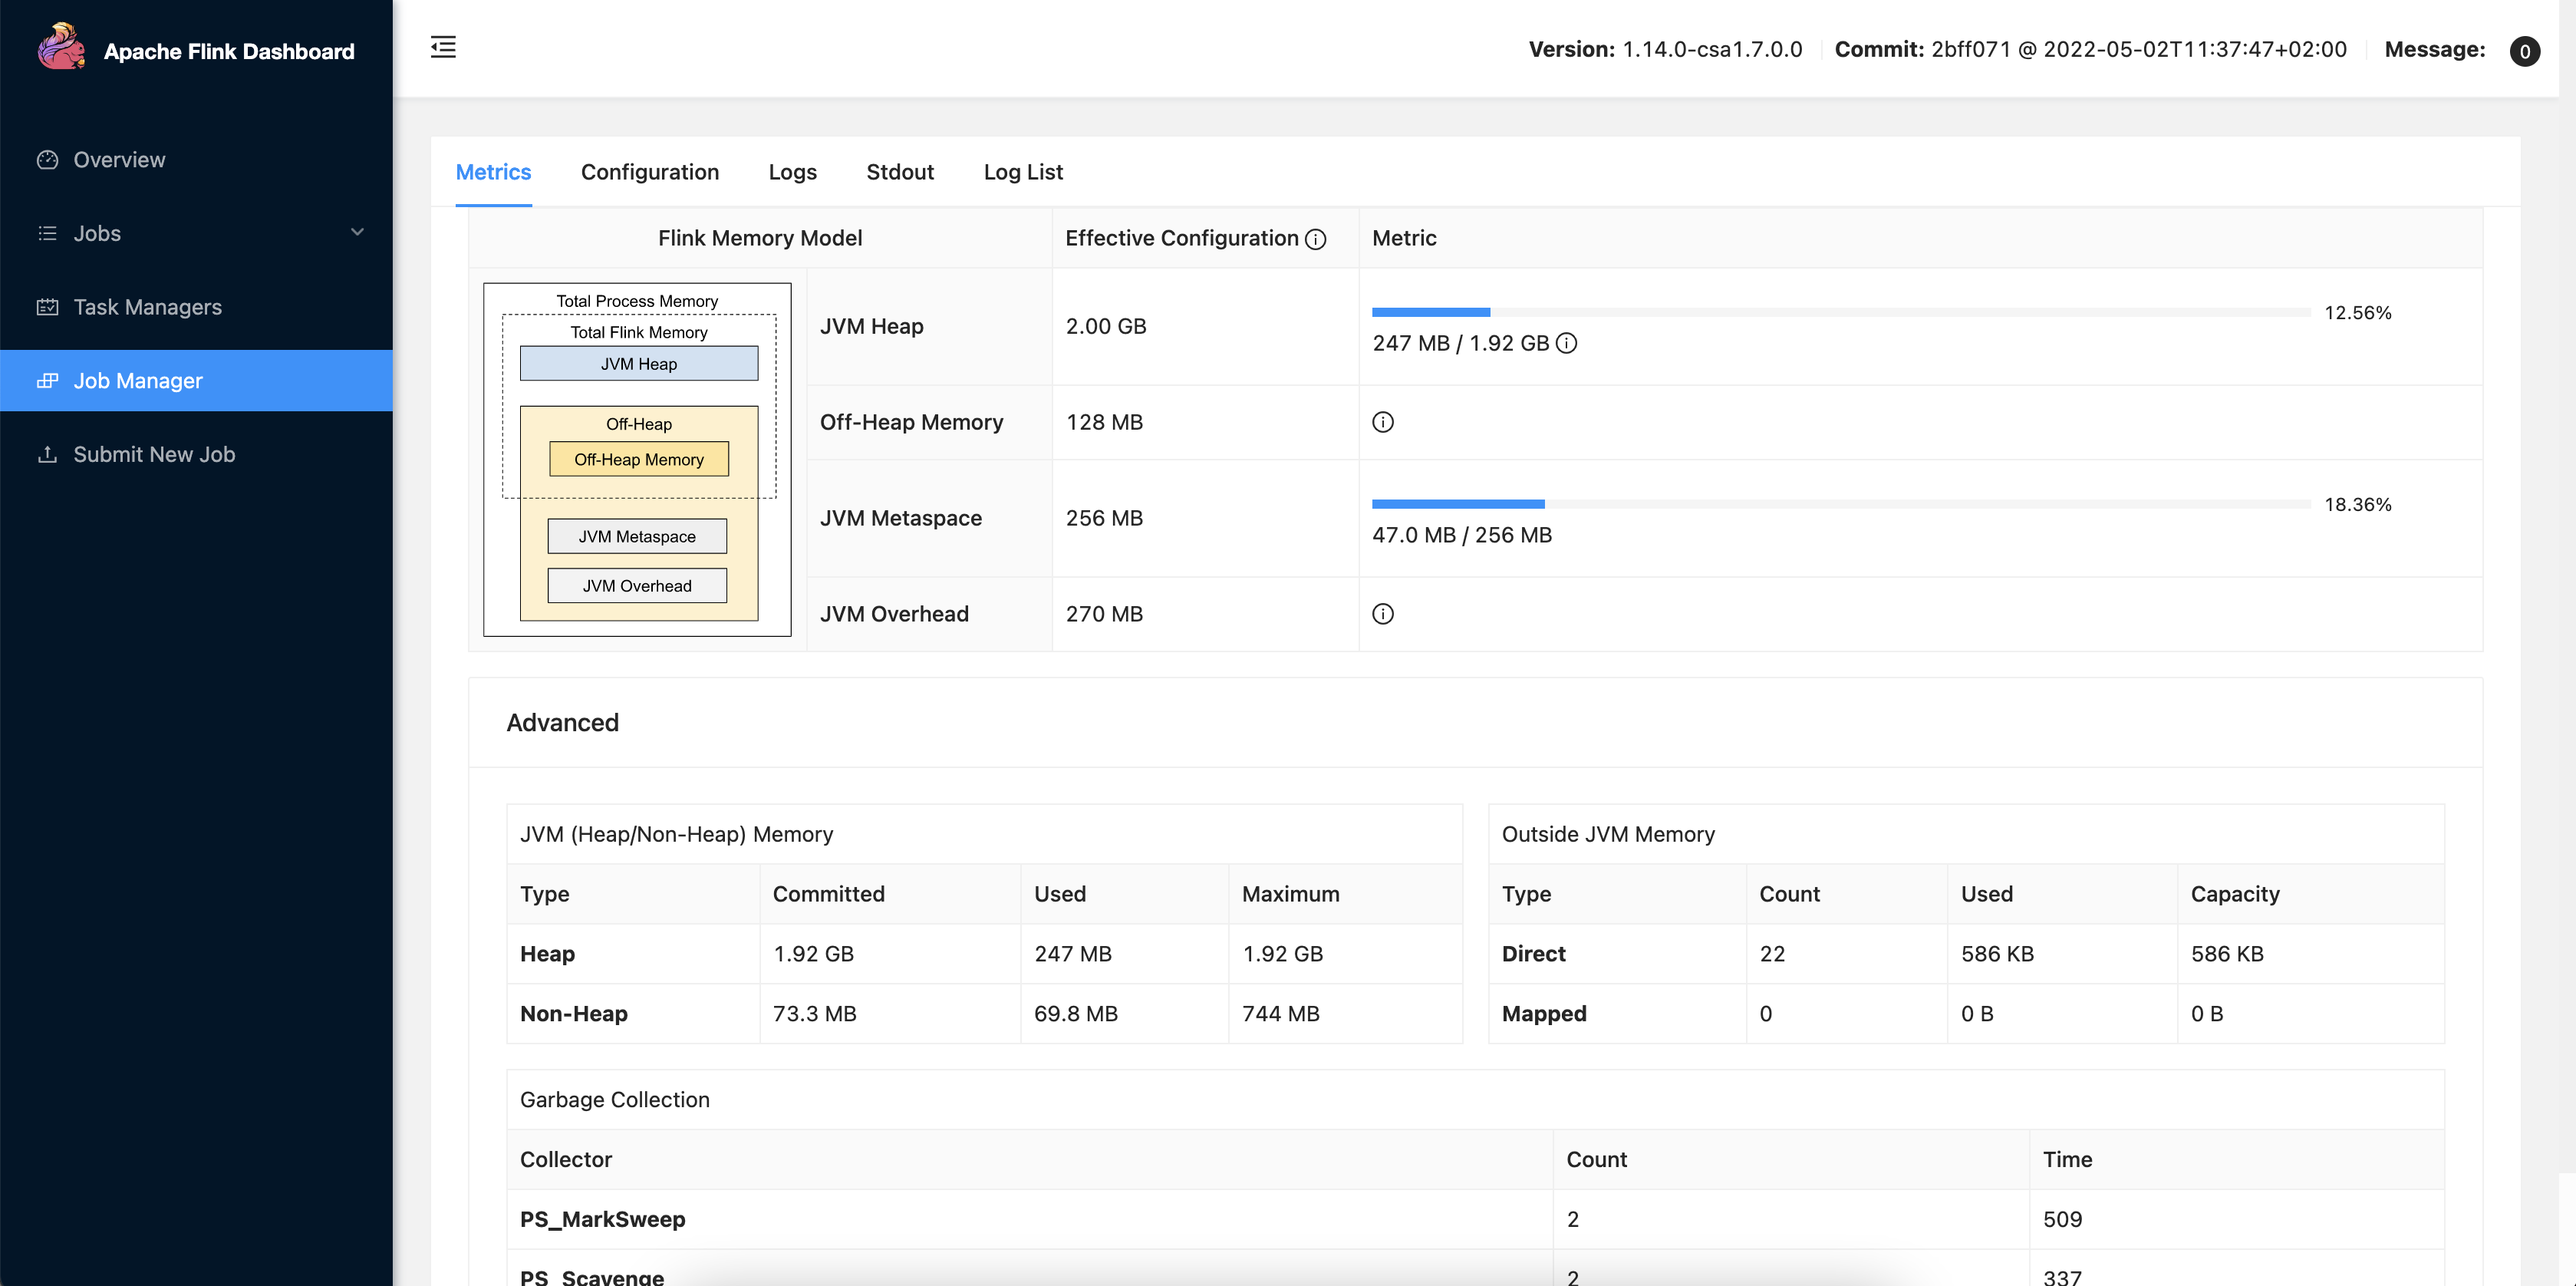
As Flink is the engine running under Cloudera SQL Stream Builder, you can use the Flink Dashboard to review your Flink jobs running as SQL jobs on the Streaming SQL Cosole.
You can reach the Flink Dashboard from Streaming SQL Console main menu, from the SQL Editor or
you can access it using http://localhost:8081.
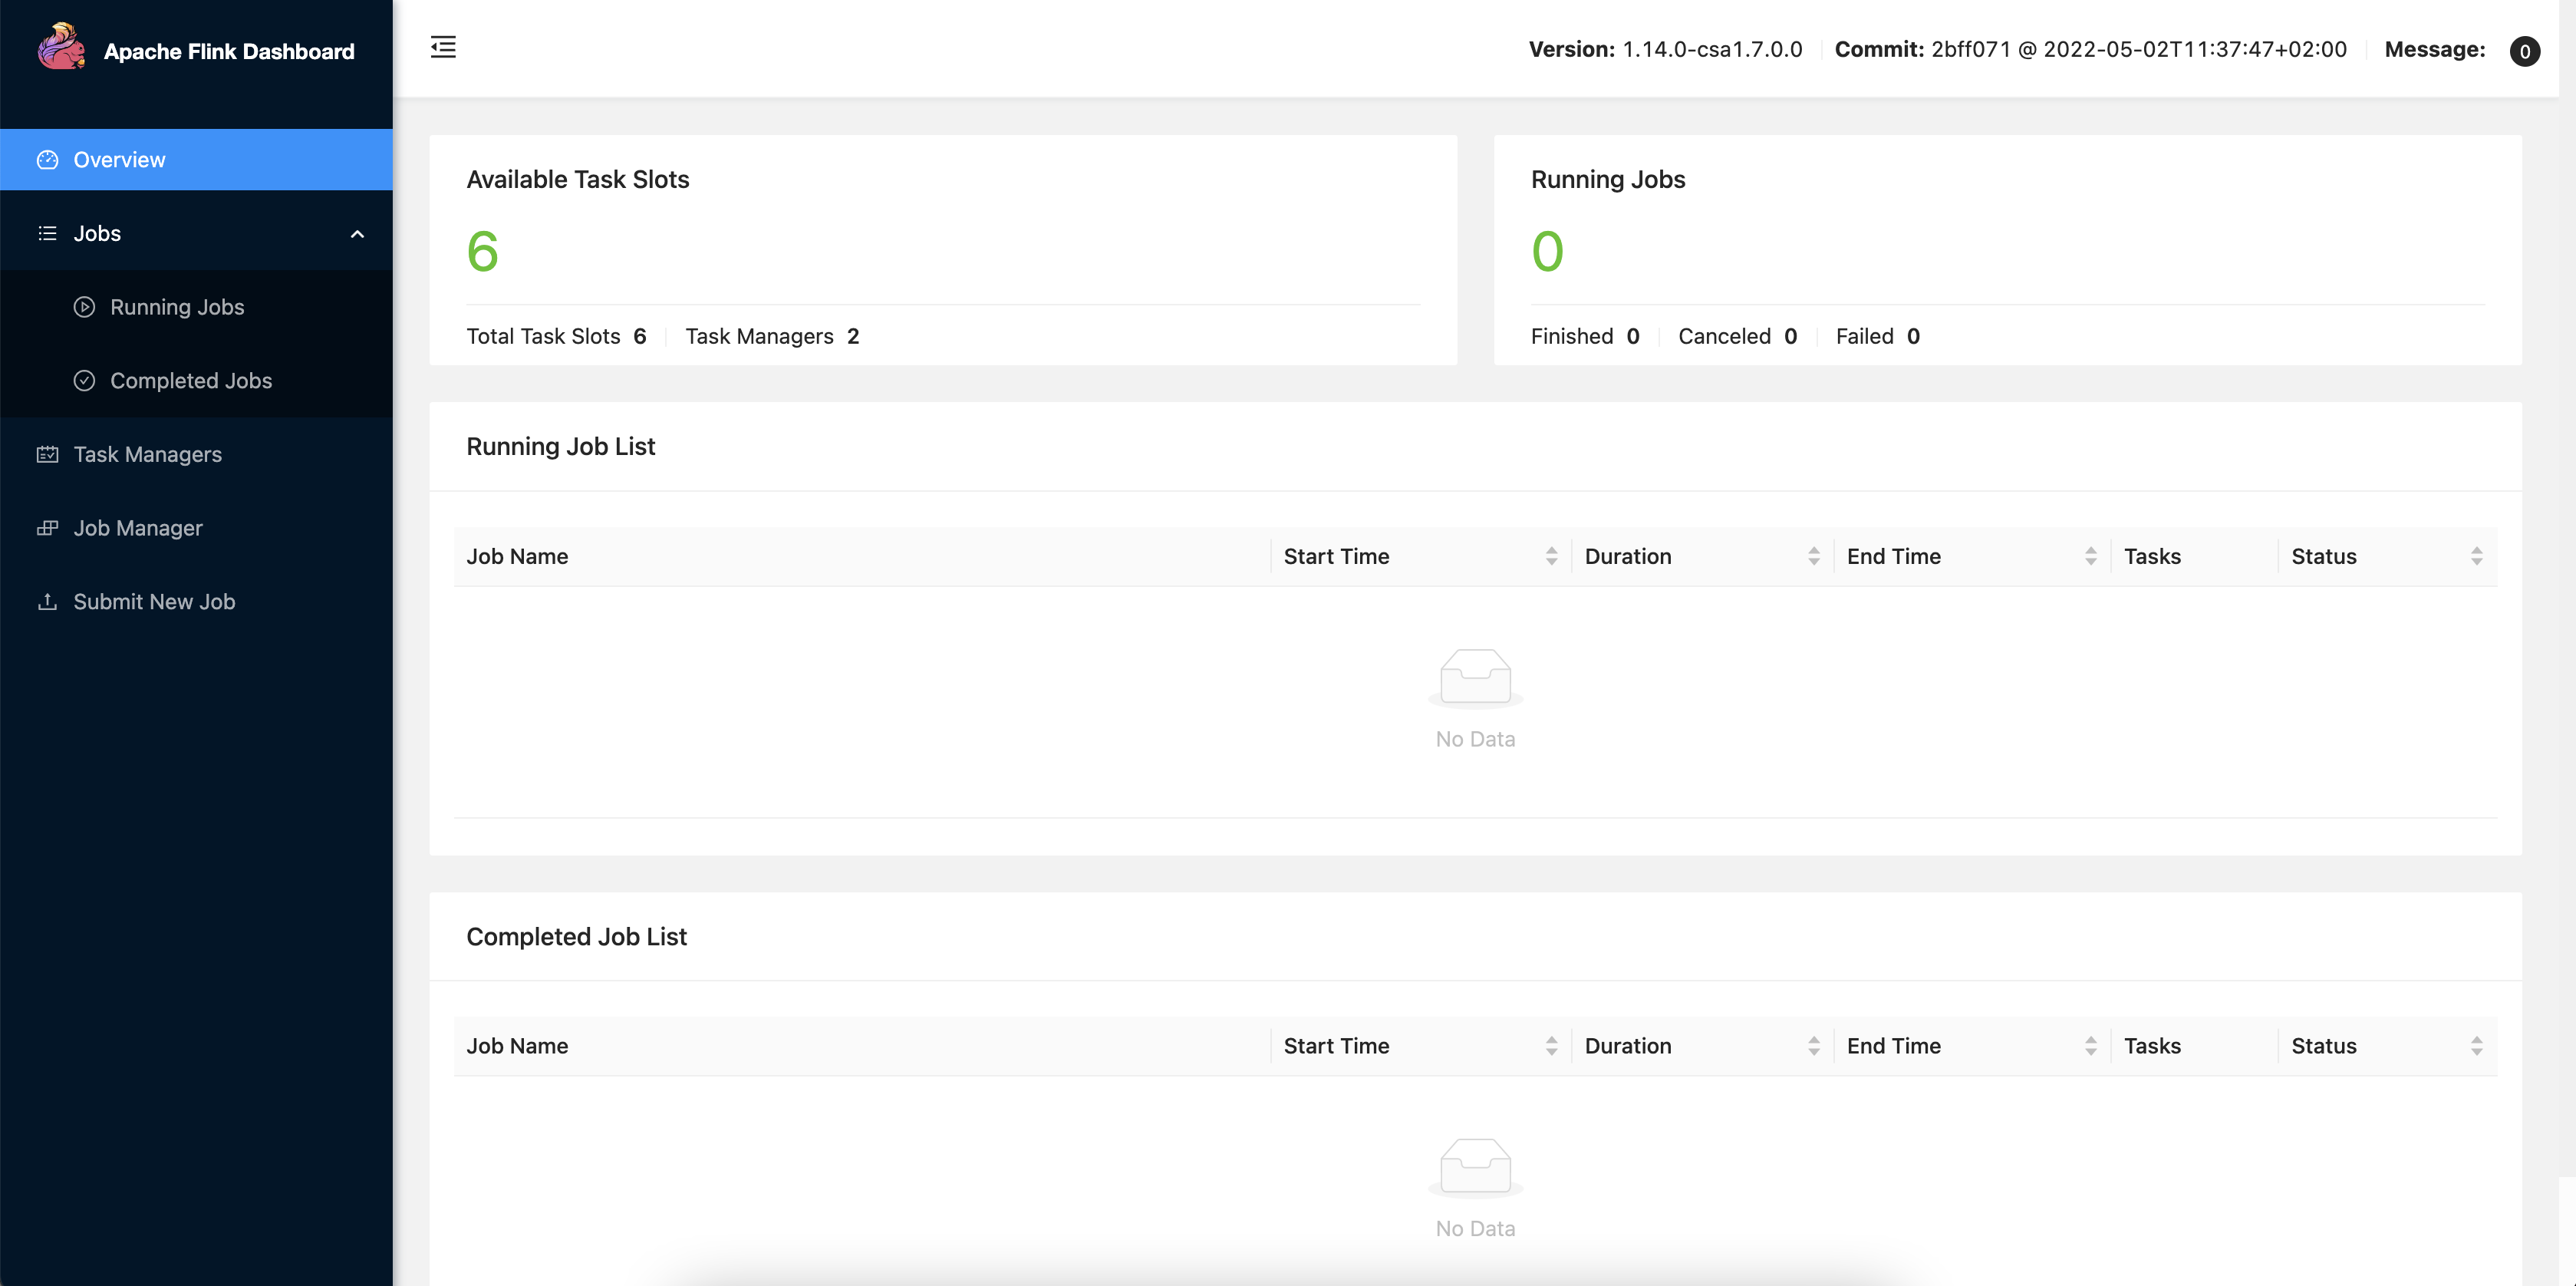
Other than checking the running and completed jobs, you can review detailed information about the Flink Task Managers and Job Managers such as the memory model, memory consumption, configuration parameters and logs.
