Tracking Profiler Jobs
Track and monitor profiler jobs using the Profilers > Jobs page to view job statuses, execution details, and troubleshoot issues. Access key information such as profiler type, job status, and profiling history to manage and analyze your assets effectively.
In Profilers, you can see your last run profiling jobs. Use this page to quickly check if your profiler jobs are failing.
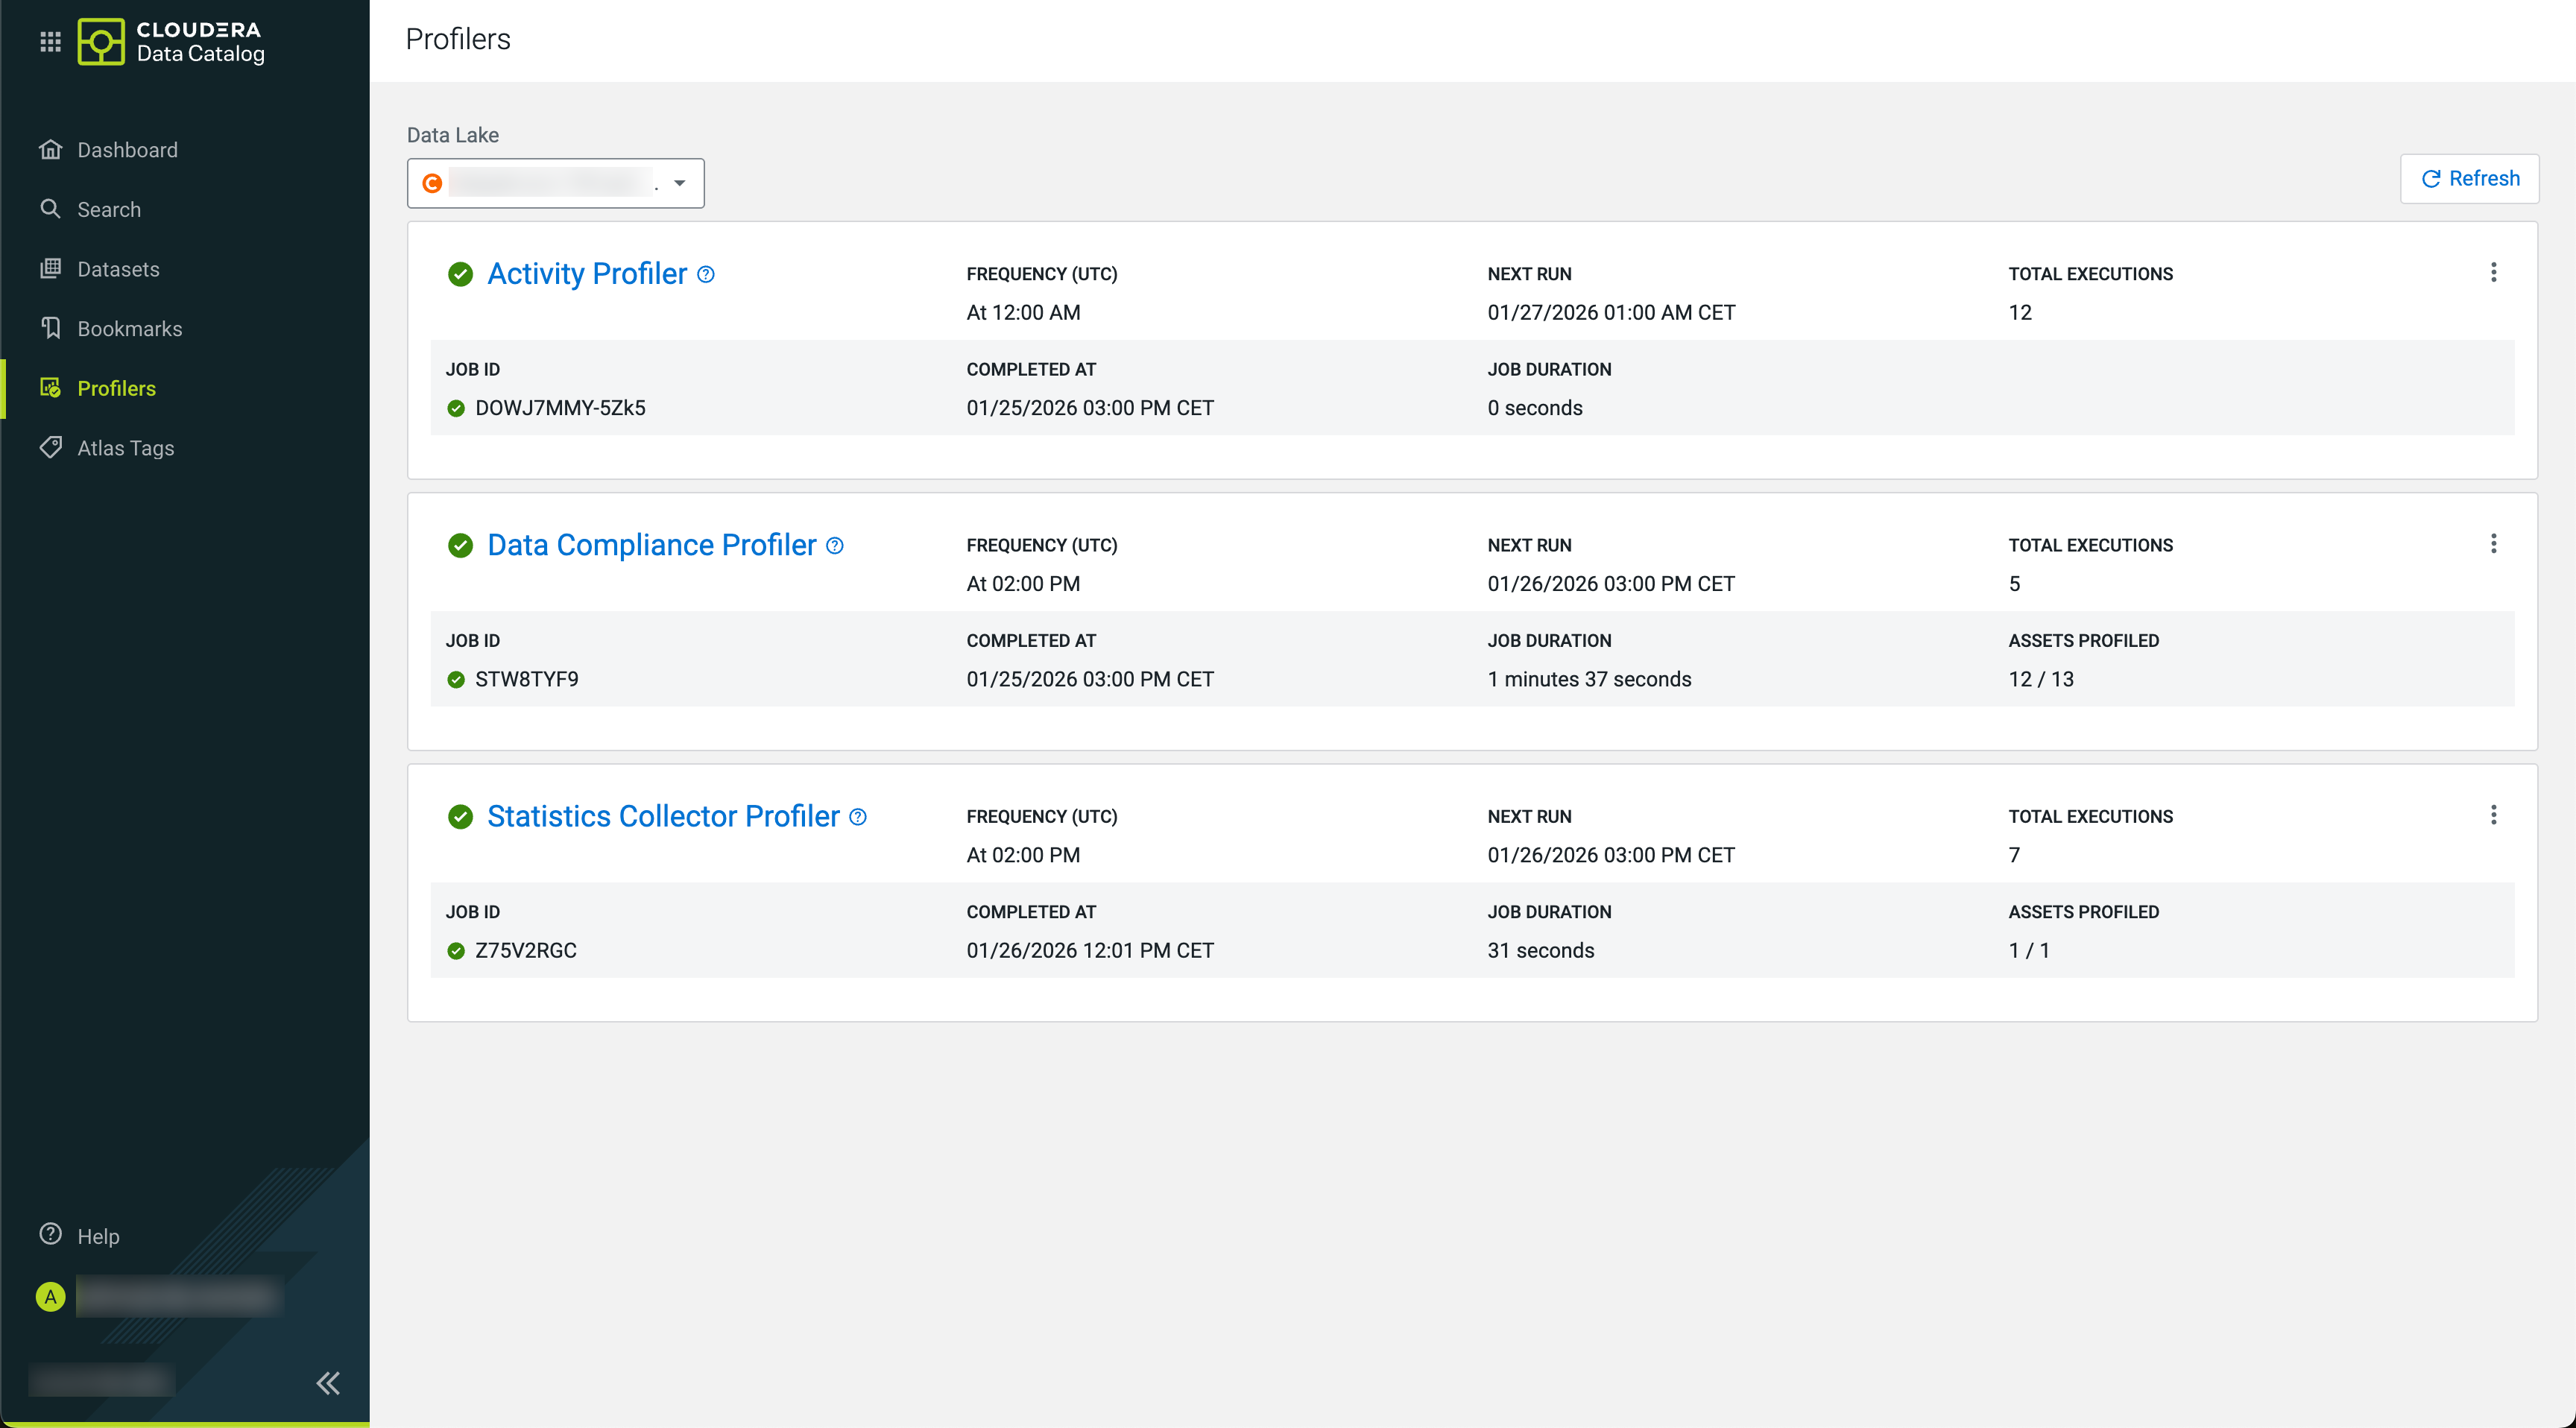
For each profiler, you can view the details about:
- Profiler type
- Profiler Status for the last job (as an icon
 ,
, ,
,  )Frequency (UTC)Next Run (in your local
timezone)Total Executions (since the launch of the profiler)
)Frequency (UTC)Next Run (in your local
timezone)Total Executions (since the launch of the profiler) - Job status is marked with icons (,,
)
- Running (Successfully launched)
- Paused
- Creation in Progress
- JOB ID of the last job
- COMPLETED AT
- JOB DURATION (of the last job)
- ASSETS PROFILED (by the last job)
Using this data can help you to troubleshoot failed jobs or even understand how the assets were profiled and other pertinent information that can help you to manage your profiled assets.
Click  >Details to gain more information about
your profiler jobs in .
>Details to gain more information about
your profiler jobs in .
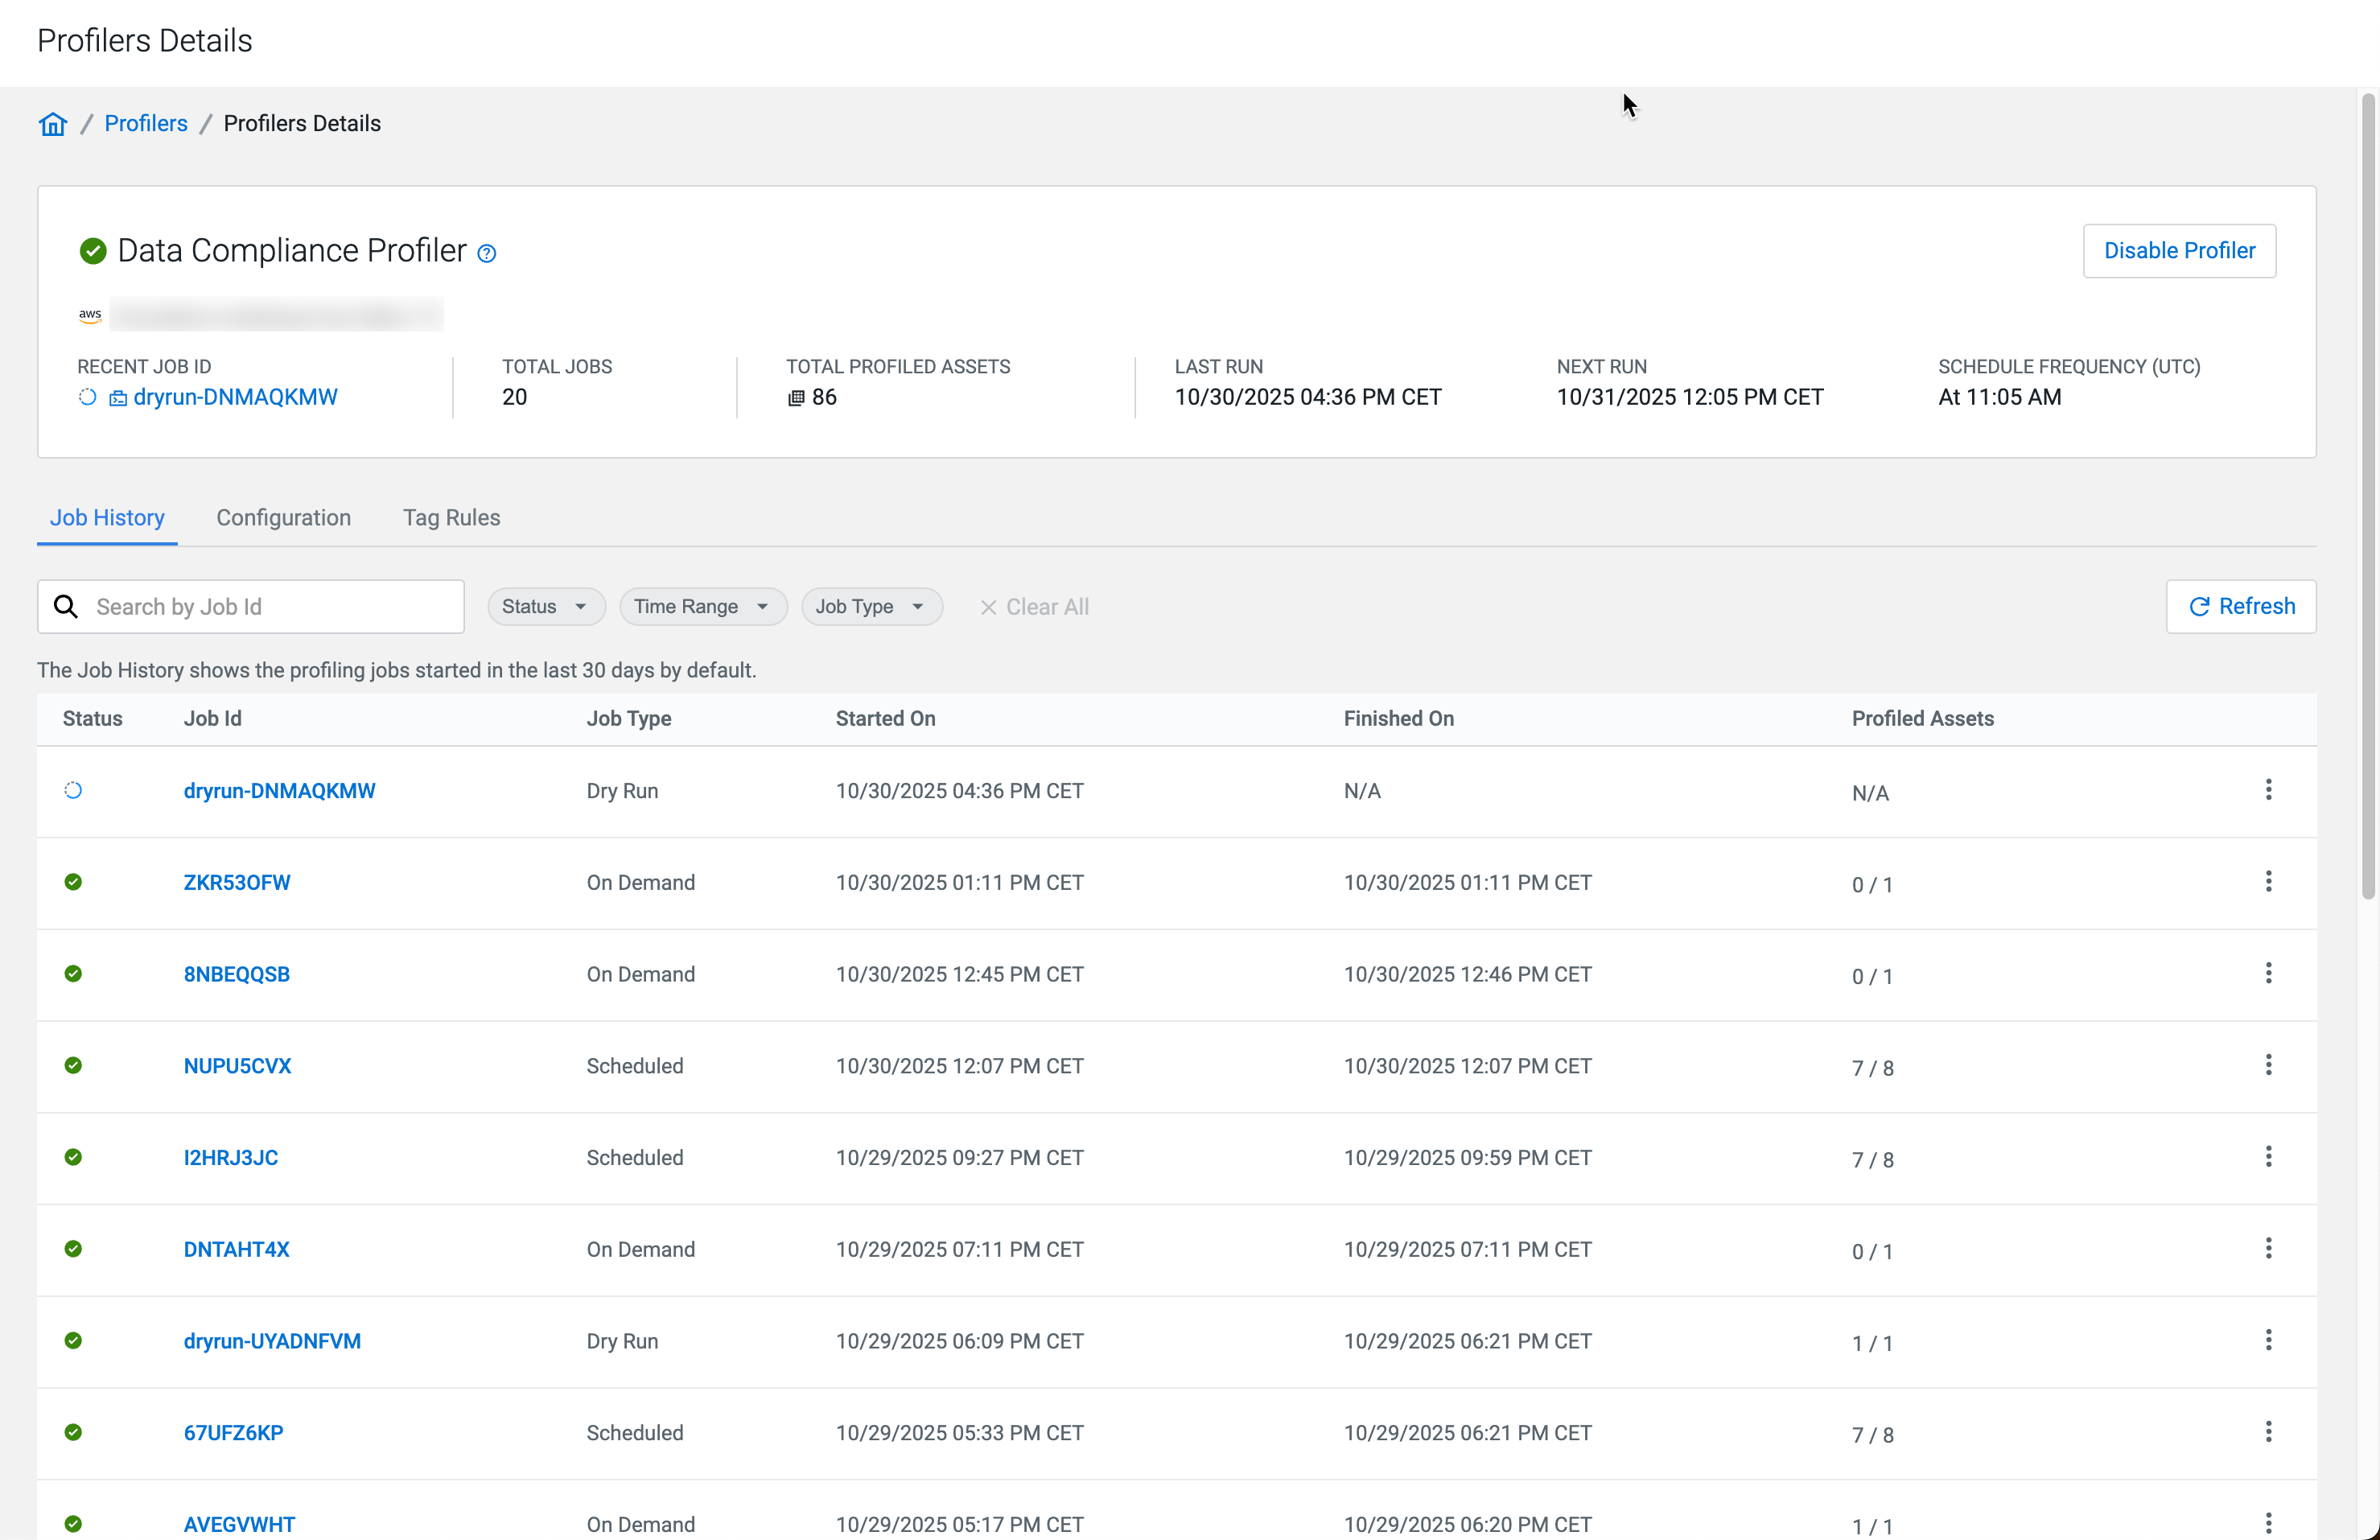
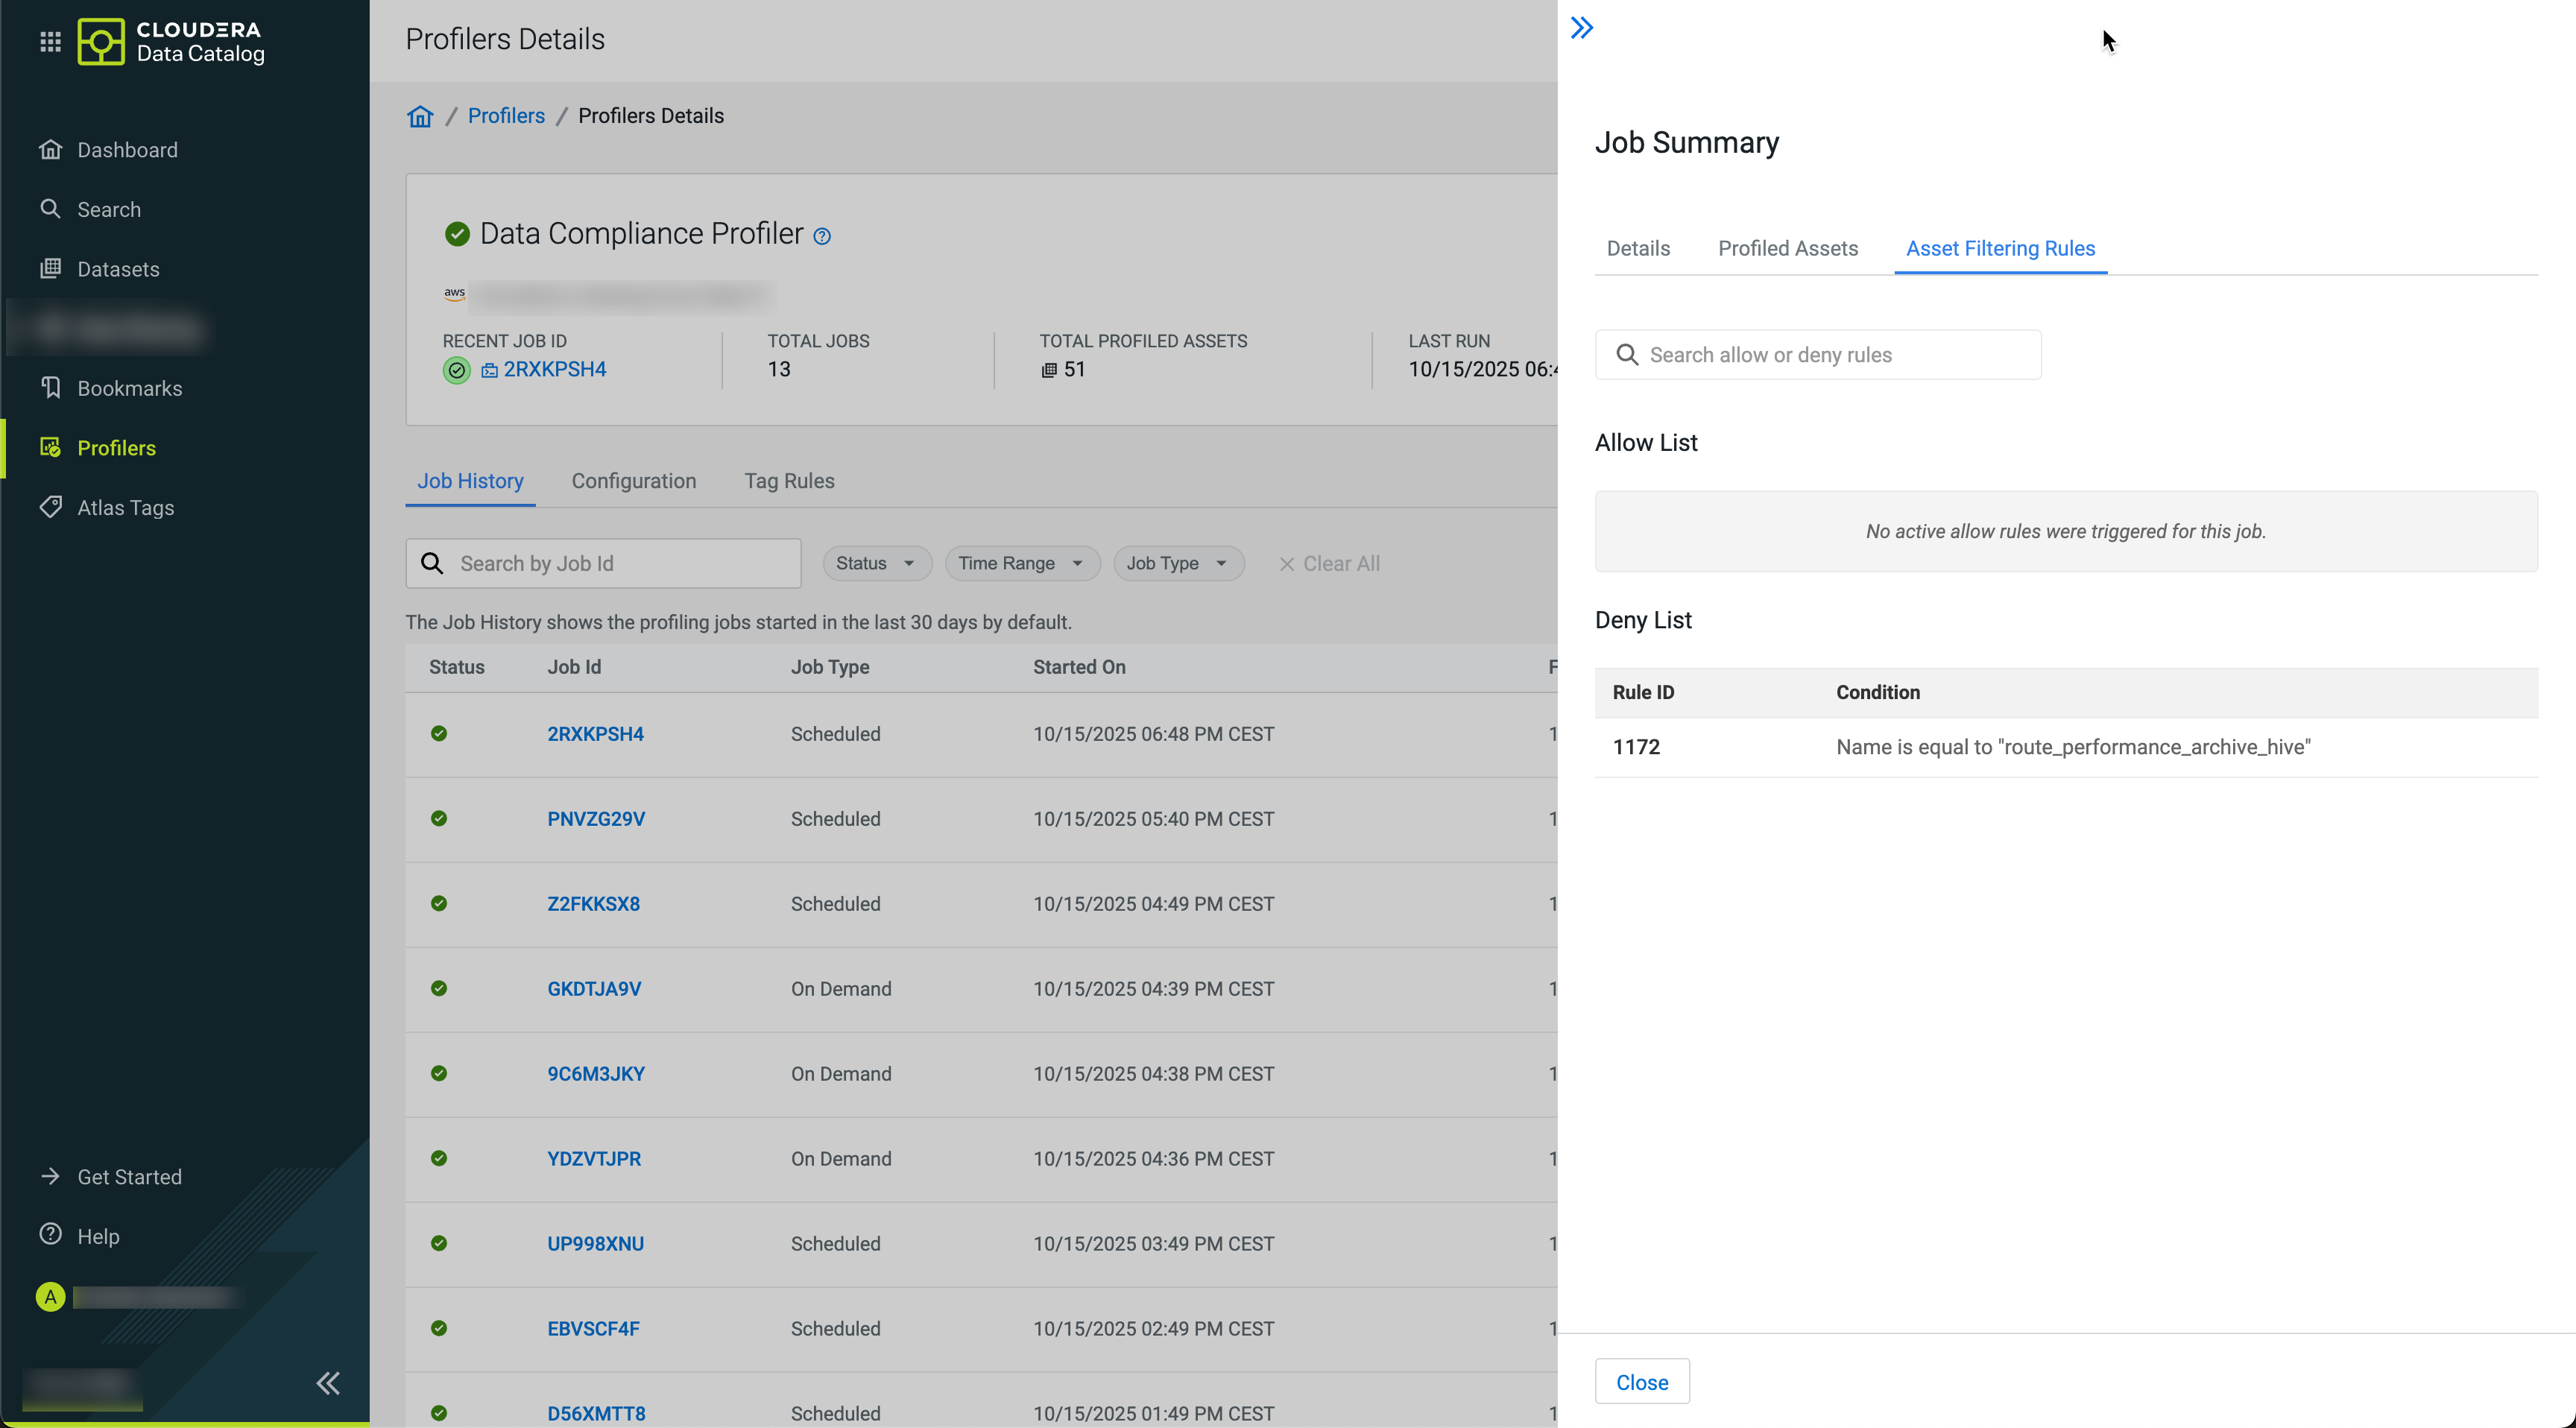
By clicking by the individual jobs in Profilers Details,
you can drill further down to Job Summary and Profiled
Assets.
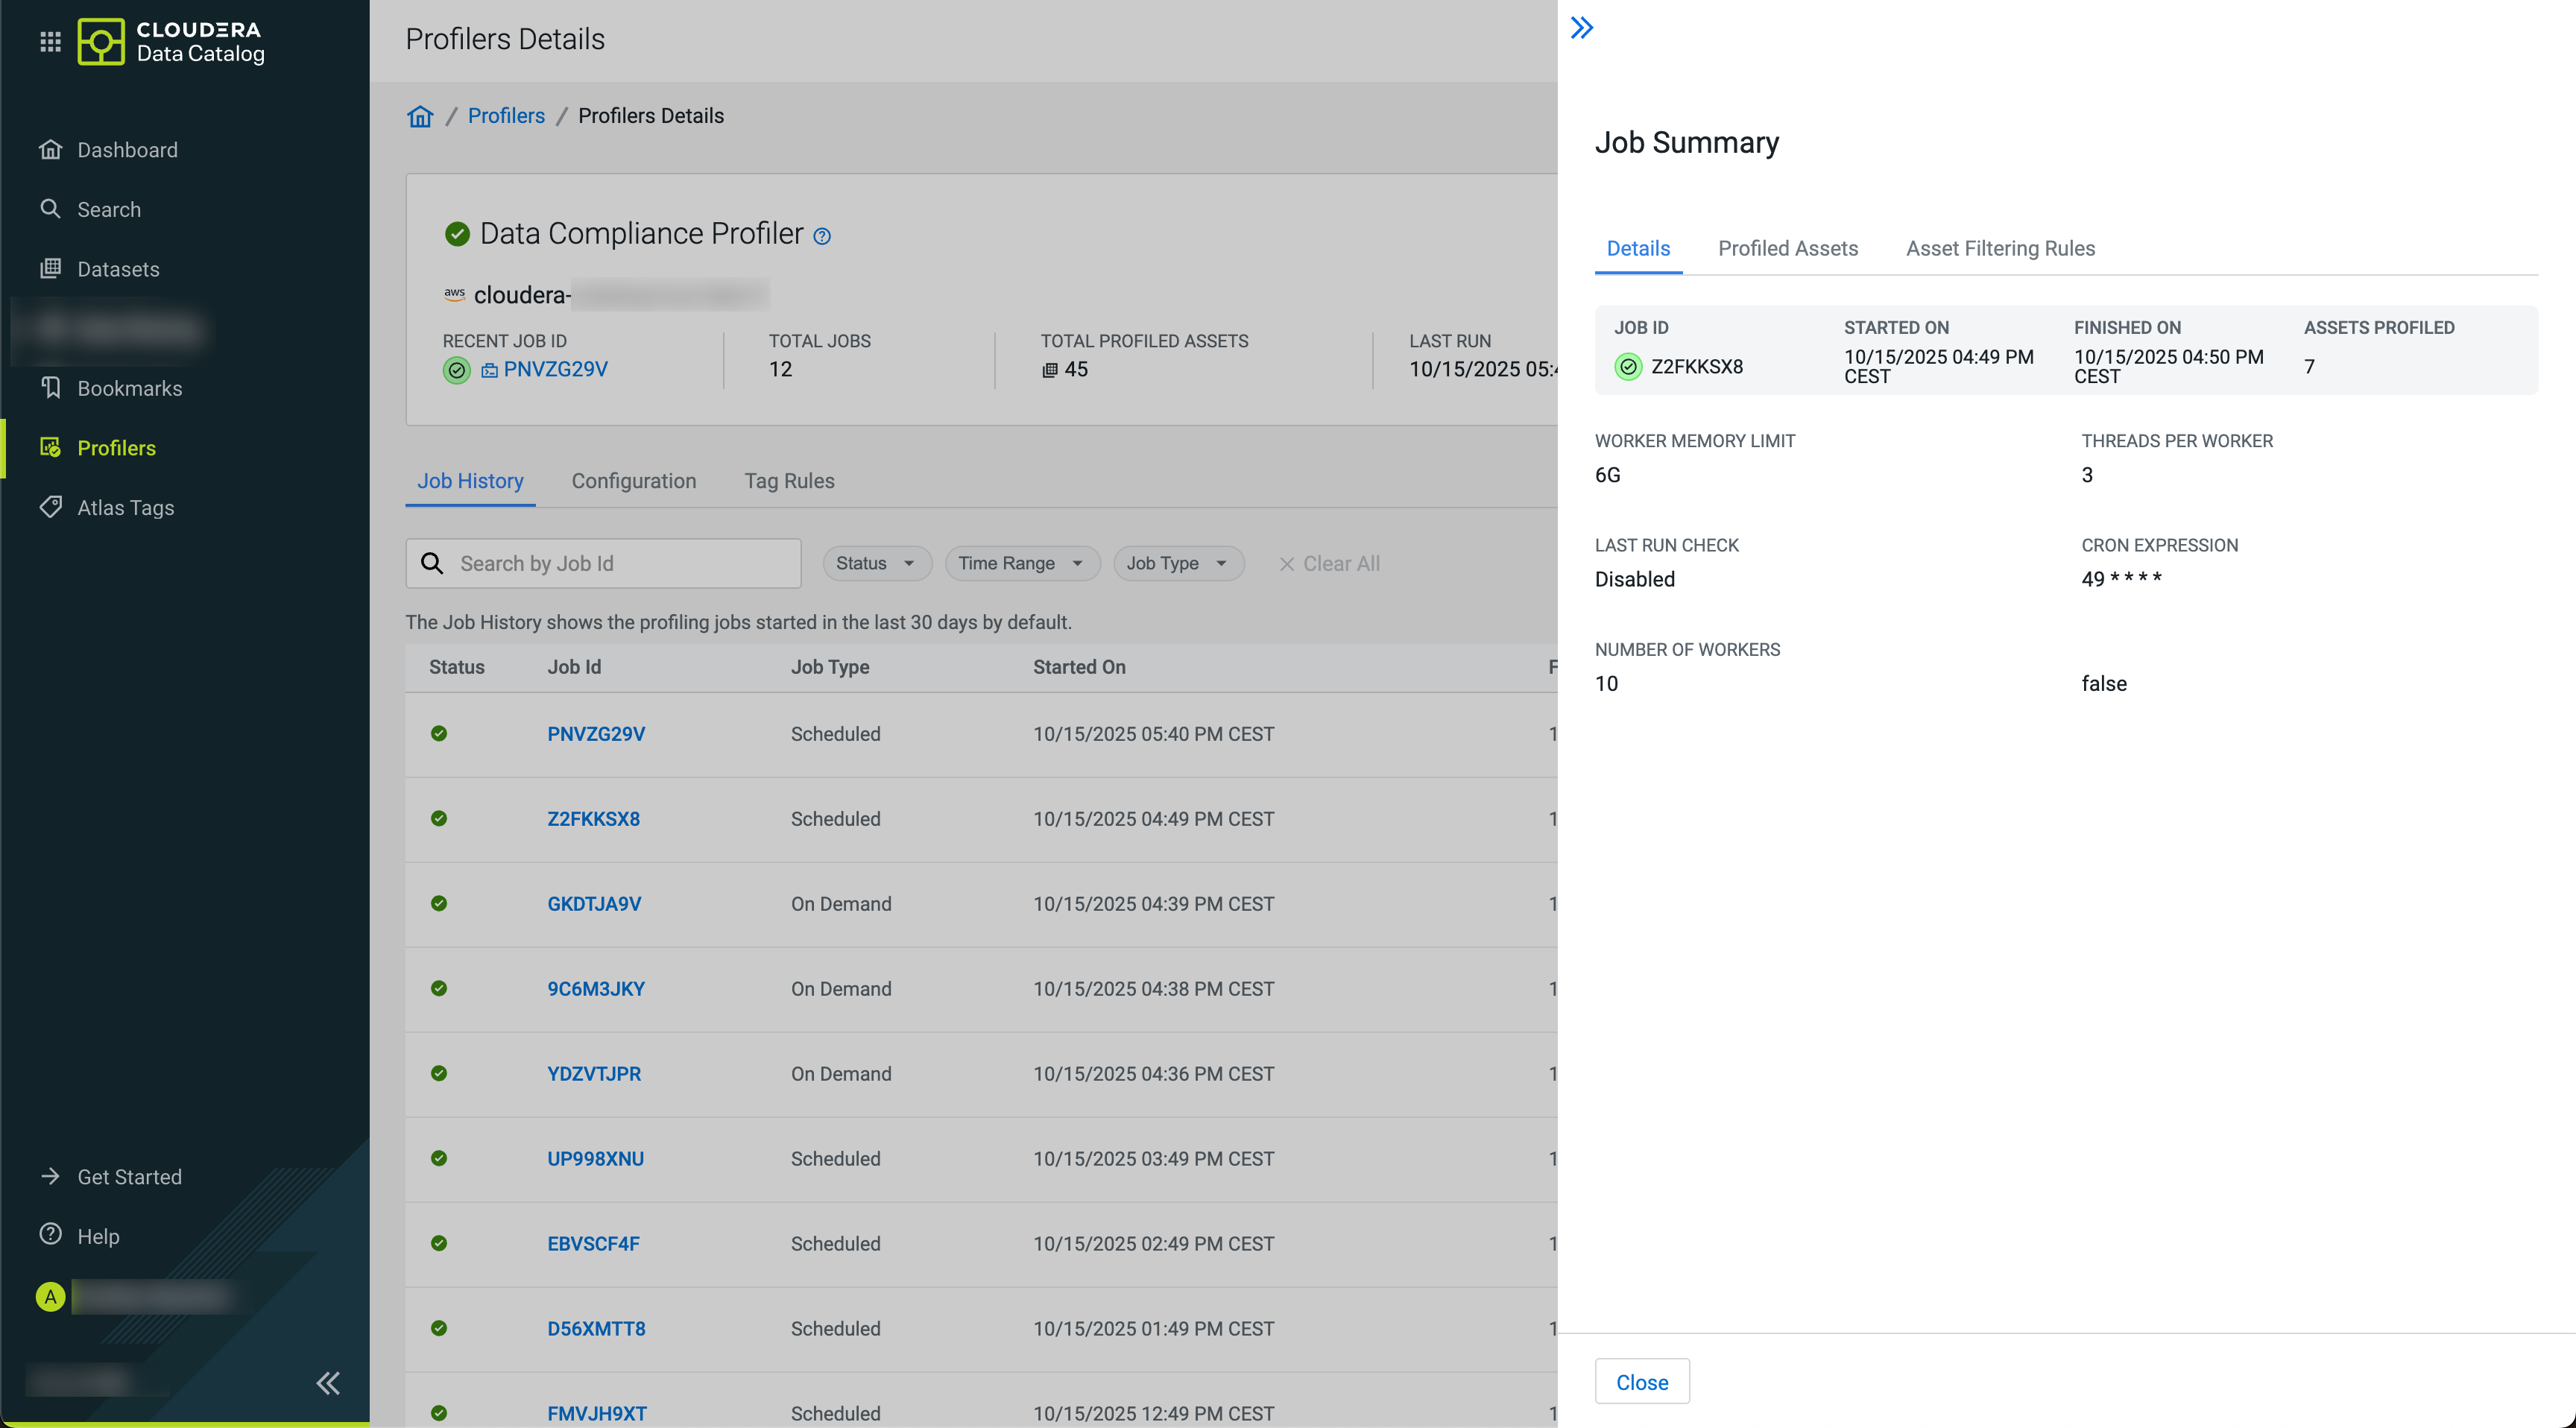
The Job Summary shows you the specific configuration applied for that particular job run.
The Profiled Assets not only gives you a list of entities that were selected by your profiler to be profiled, but it let's you filter them.
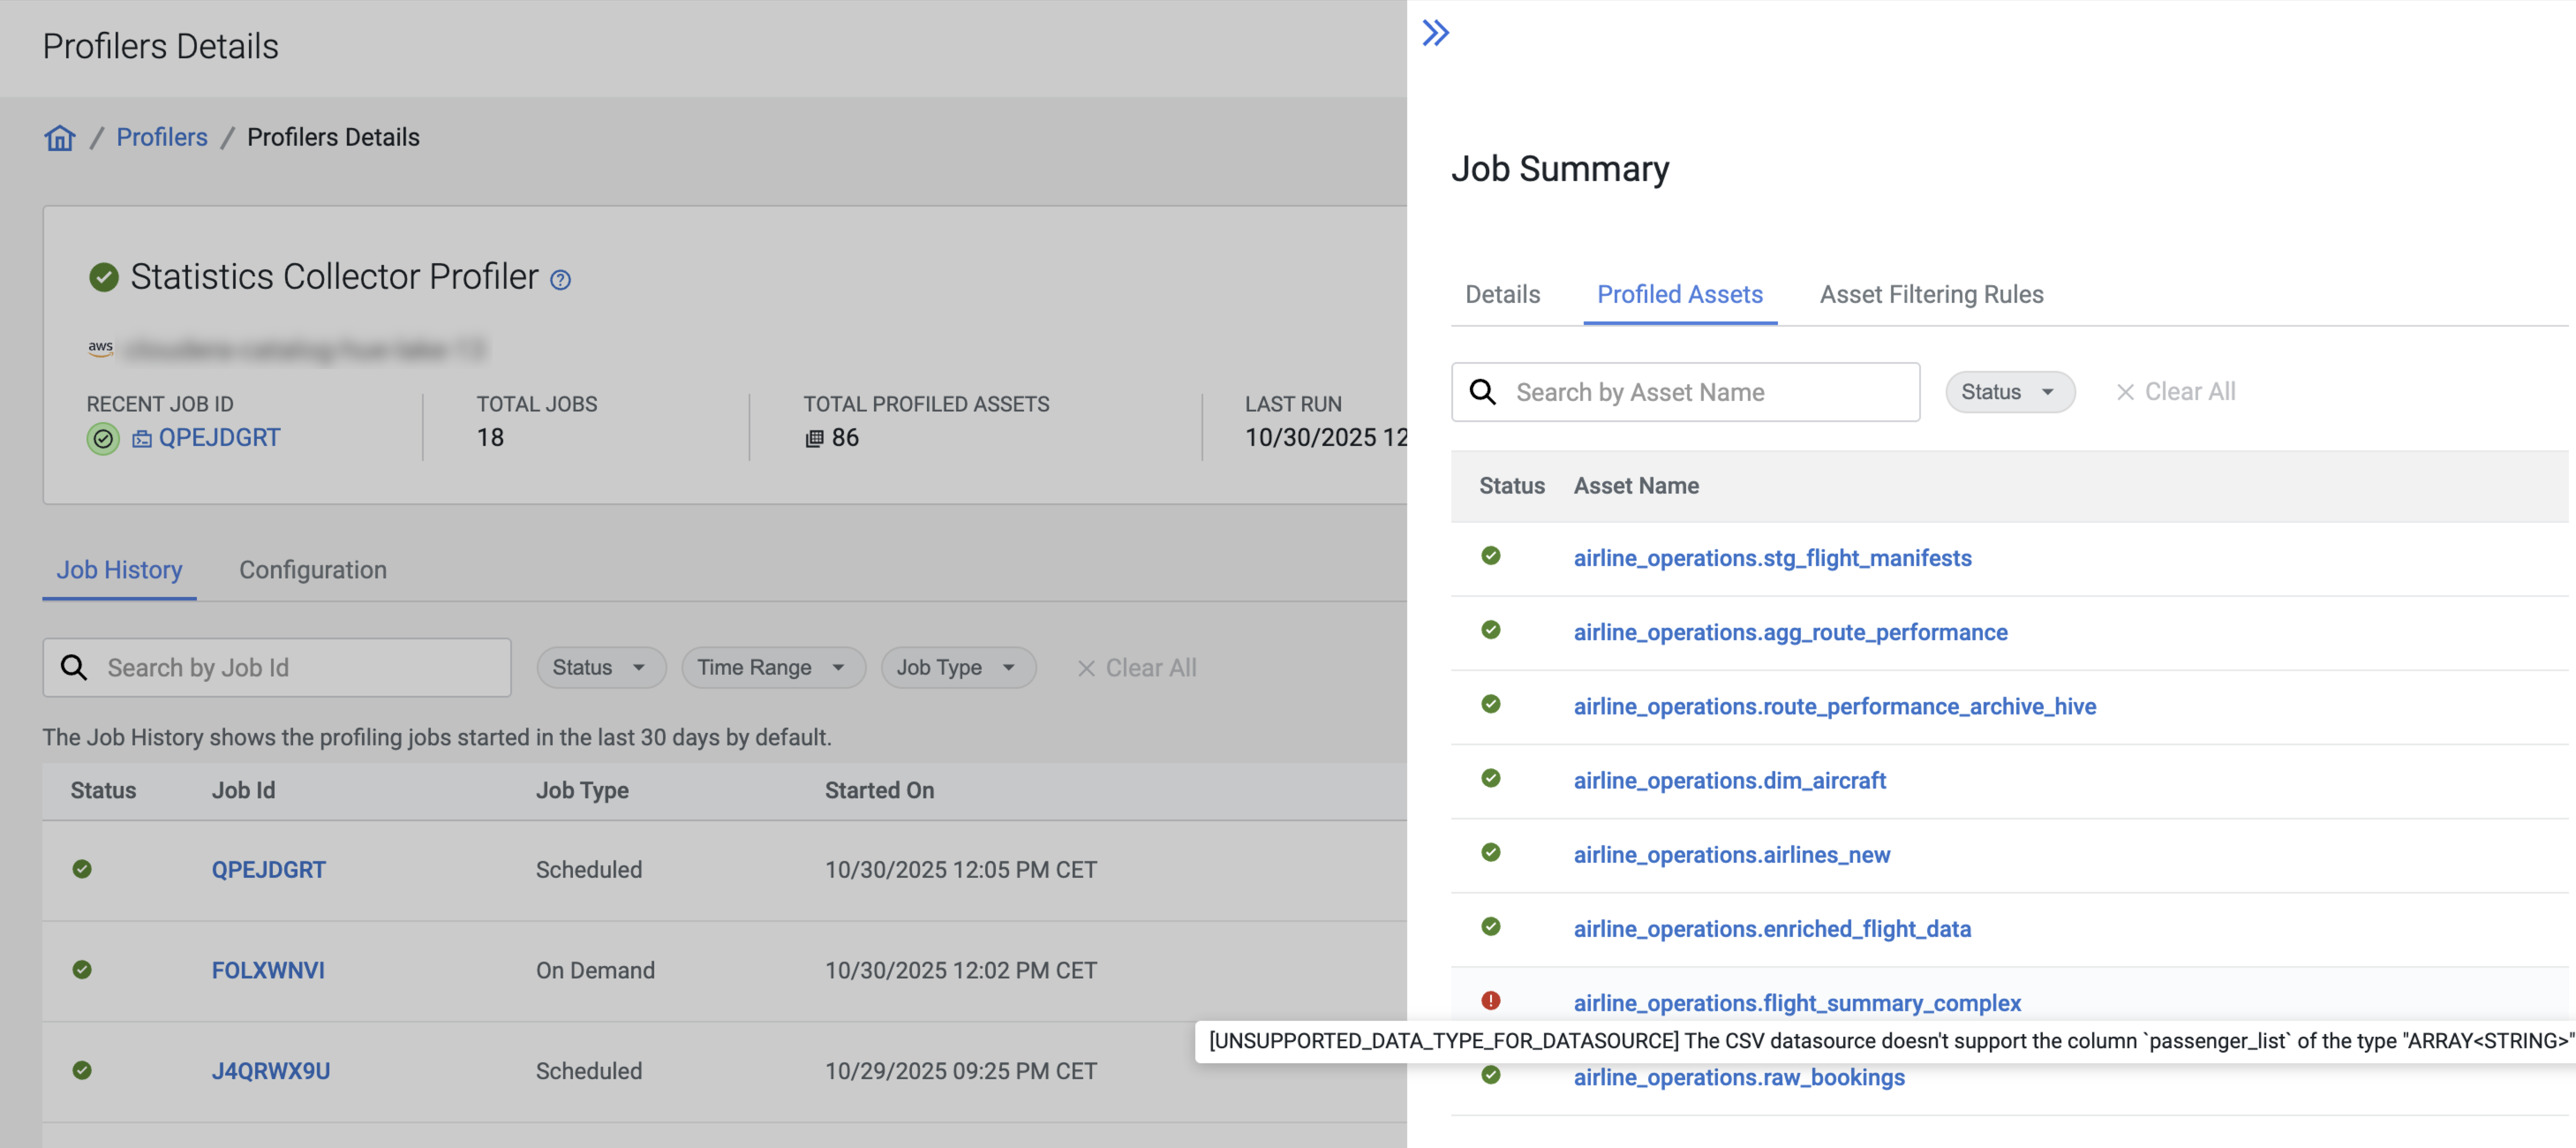
The Asset Filtering Rules tab summarizes the active filtering rules for your profiling job.
Under , you can have an overview of your started profiler jobs. By using the D, W, M filters, you can go back up to a day, week or a month, to see your previous jobs. Use this page to quickly check if your profiler jobs are failing.
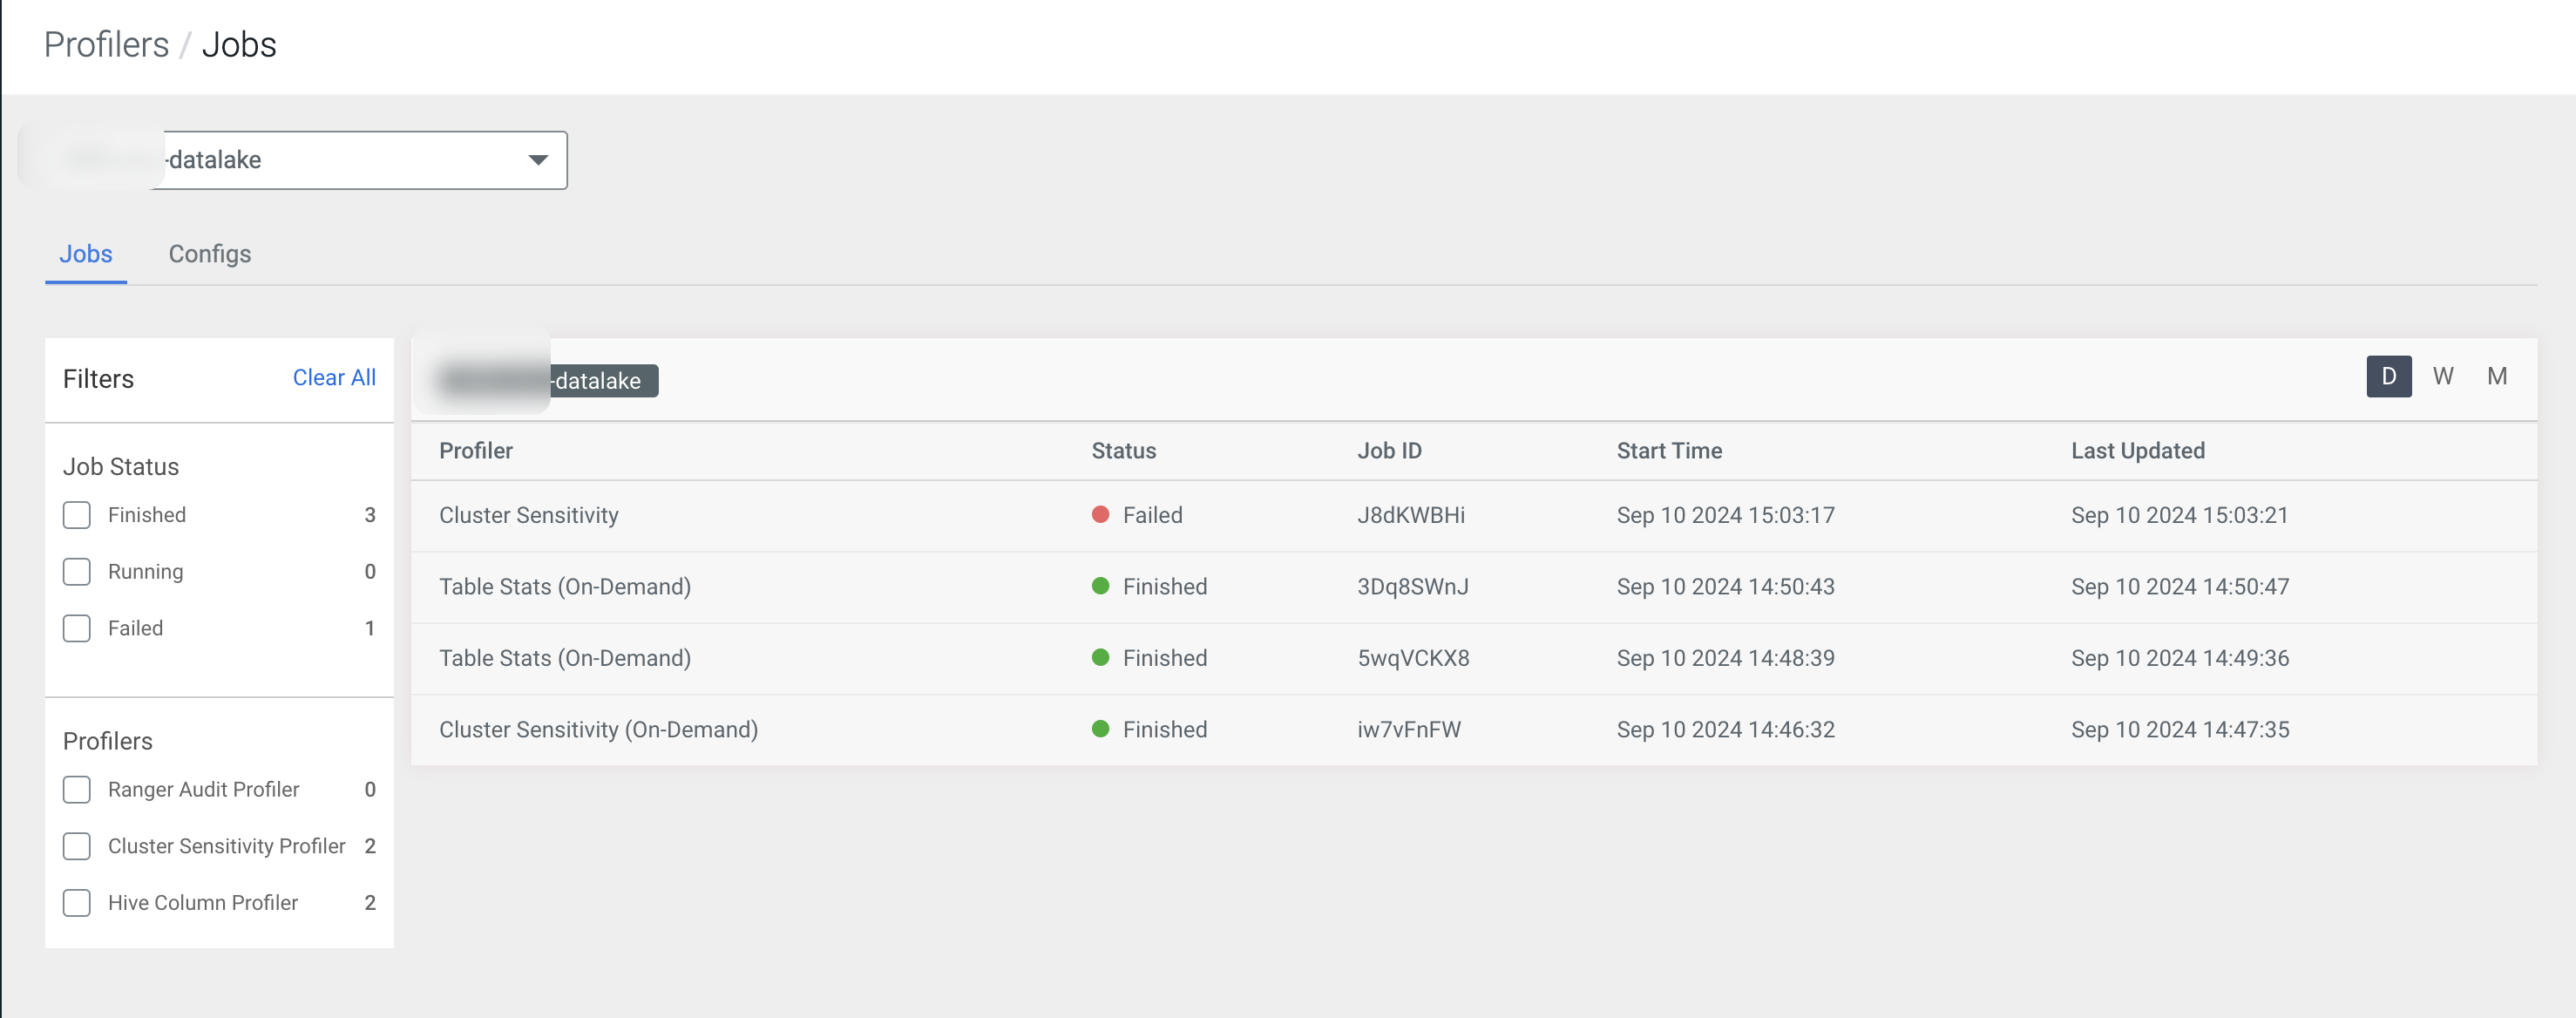
For each profiler job, you can view the details about:
- Profiler type
- Job Status
- Job ID
- Start Time
- Last Updated Time
Using this data can help you to troubleshoot failed jobs or even understand how the jobs were profiled and other pertinent information that can help you to manage your profiled assets.
In case of Ranger Audit profiling, there could be a “NA” status for the total number of assets profiled. It indicates that the auditing that happens is dependent on the Ranger policies. In other words, the Ranger policies are actually profiled and not the assets.