Connecting to Grafana dashboards in Cloudera Data Engineering on premises
This topic describes how to access Grafana dashboards for advanced visualization of Virtual Cluster's metrics such as memory and CPU usage in Cloudera Data Engineering on premises.
- In the Cloudera console, click the Data Engineering tile. The Home page displays.
- Click Administration in the left navigation menu and locate a
Service in the Services column and click Service
Details on the environment for which you want to see the Grafana dashboard.
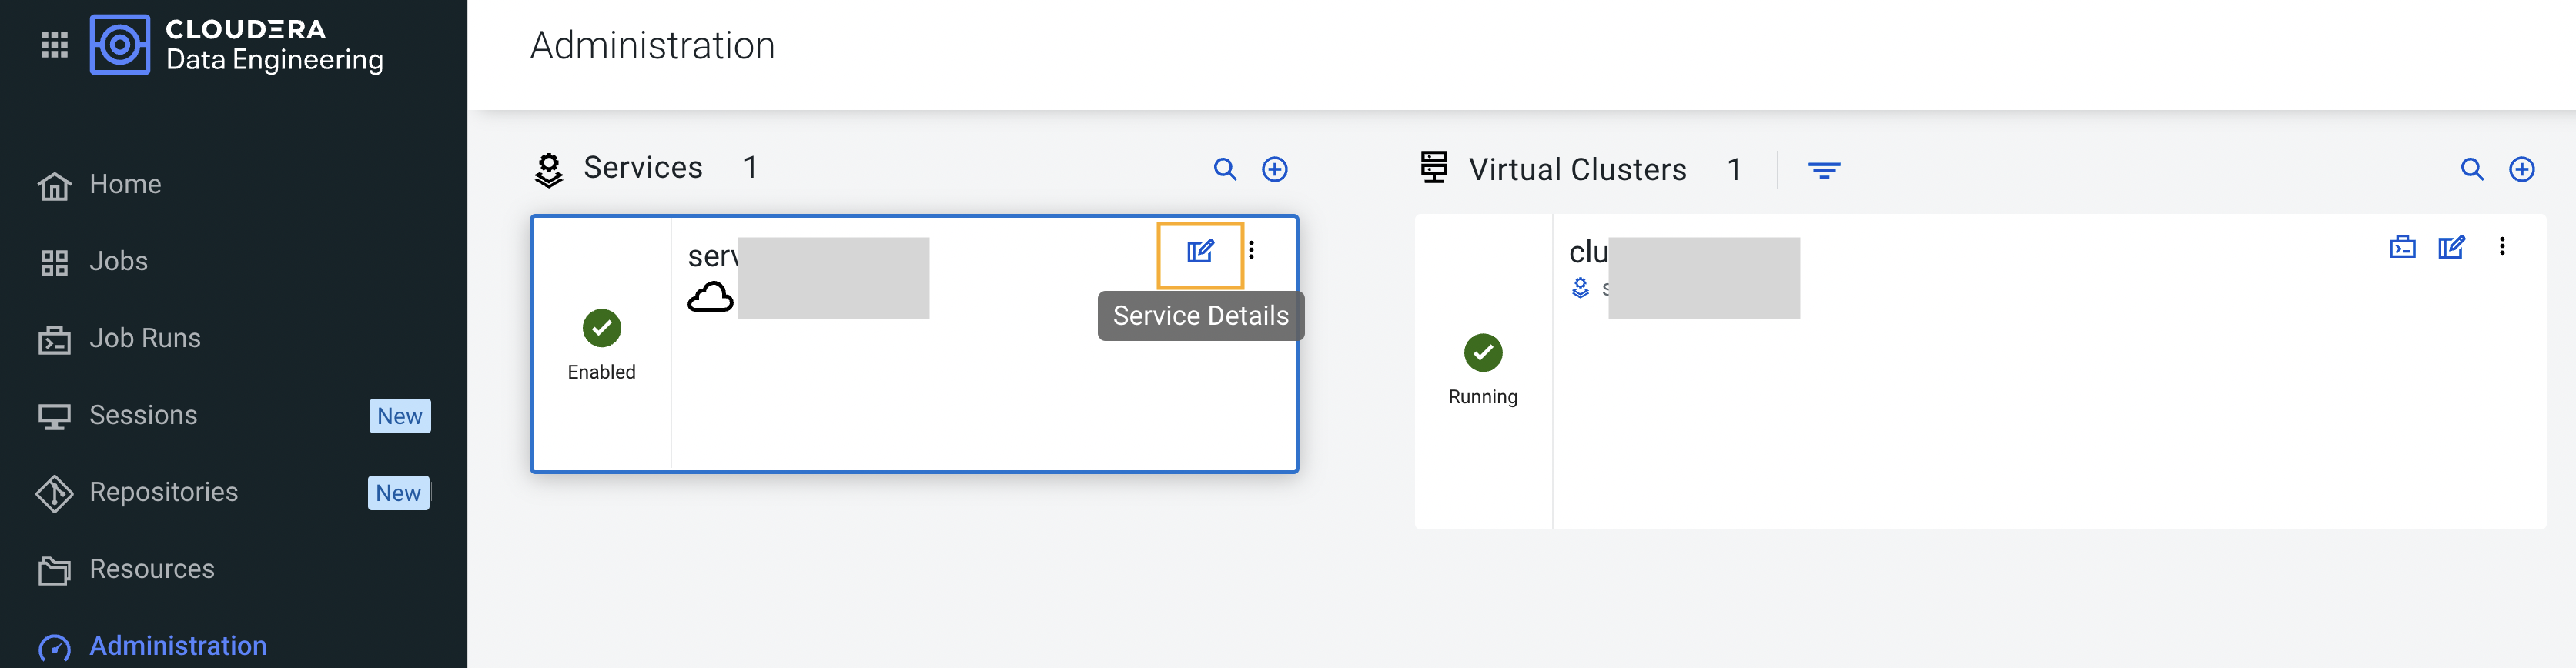
- In the Administration/Service page, click Grafana Charts. A read-only version of the Grafana interface opens in a new tab in your browser.
- In the Grafana dashboard, click the grid icon
 in the left navigation menu.
 - Select Virtual Cluster Metrics under the Dashboards pane.
- Click on a virtual cluster name from the dropdown list to view the Grafana charts.
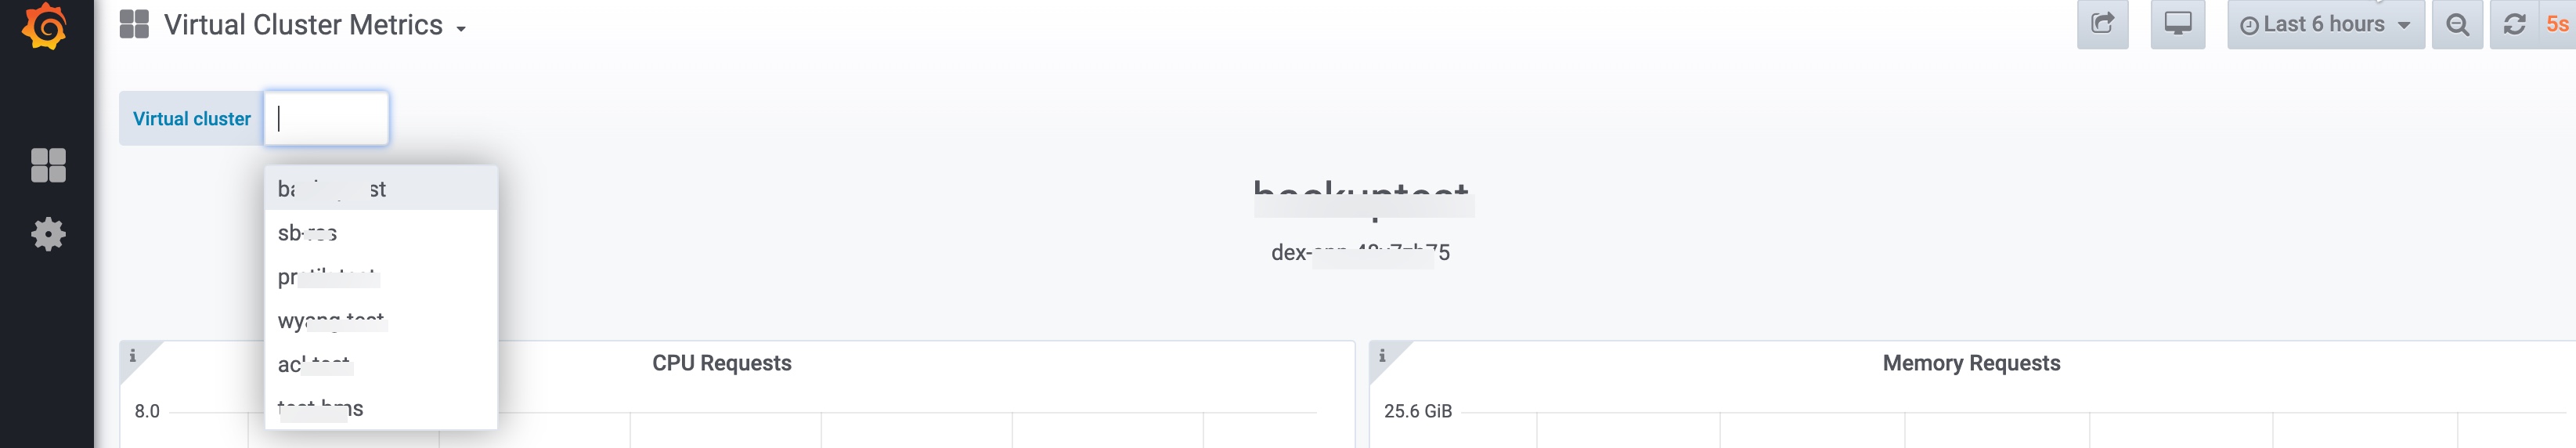 Information about CPU requests, memory requests, jobs, and other information related
to the virtual cluster is displayed.
Information about CPU requests, memory requests, jobs, and other information related
to the virtual cluster is displayed.
- In the Cloudera console, click the Data Engineering tile. The Cloudera Data Engineering Home page displays.
- Click Administration in the left navigation menu and locate a Service in the Services column.
- Navigate to the virtual cluster for which you want to see the Grafana dashboard.
- Click Cluster Details for the virtual cluster.
The Administration/Virtual Cluster page is displayed.
- Click Grafana Charts.
A read-only version of the Grafana interface opens in a new tab in your browser.
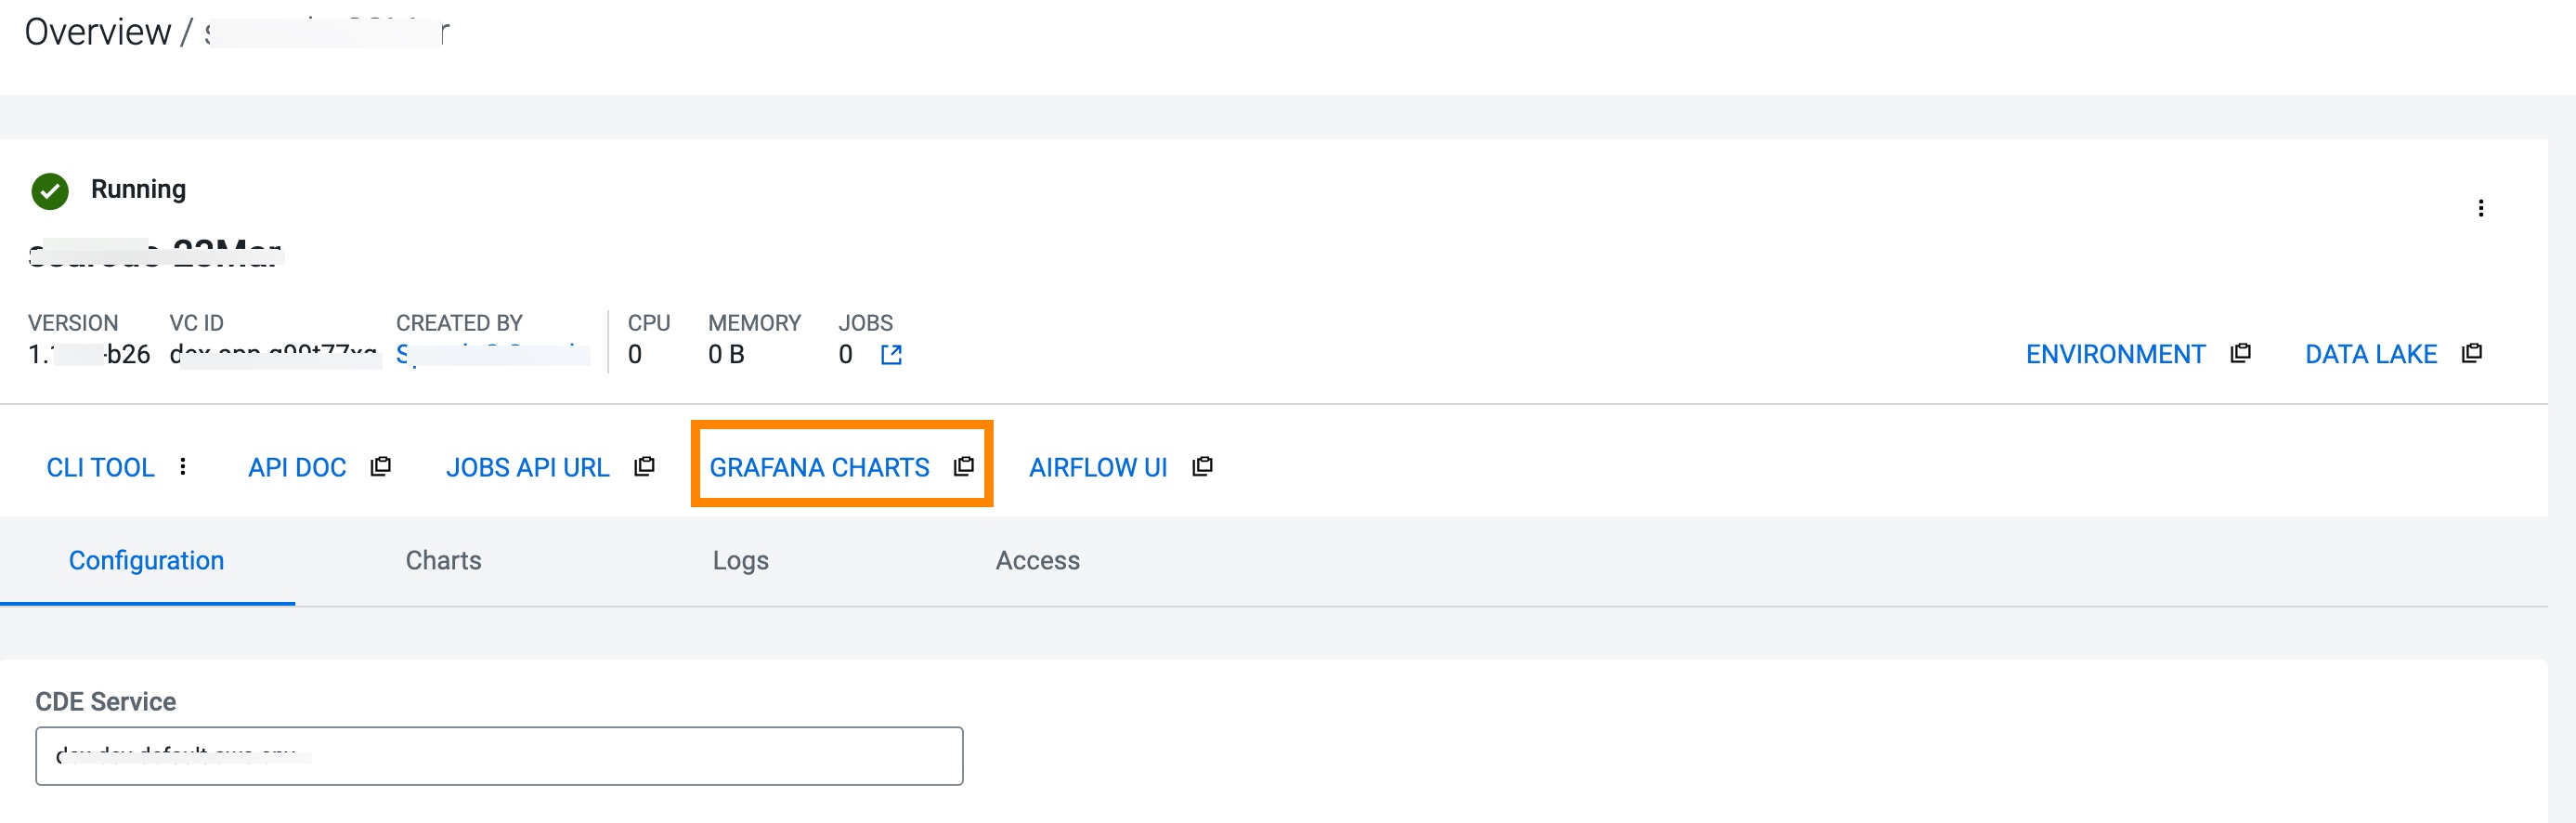
Information about CPU requests, memory requests, jobs, and other information related to the virtual cluster is displayed.
- In the Virtual Cluster Metrics page, click on a virtual cluster name from the Virtual Cluster dropdown list to view the Grafana charts of that virtual cluster.