Accessing Grafana dashboards
Cloudera provides pre-built Grafana dashboards comprising metrics data, charts, and other visuals. You can access pre-built Grafana dashboards to monitor your jobs and virtual clusters in Cloudera Data Engineering. You can immediately view the Kubernetes and Virtual Cluster Metrics pre-built dashboards in Cloudera Data Engineering.
-
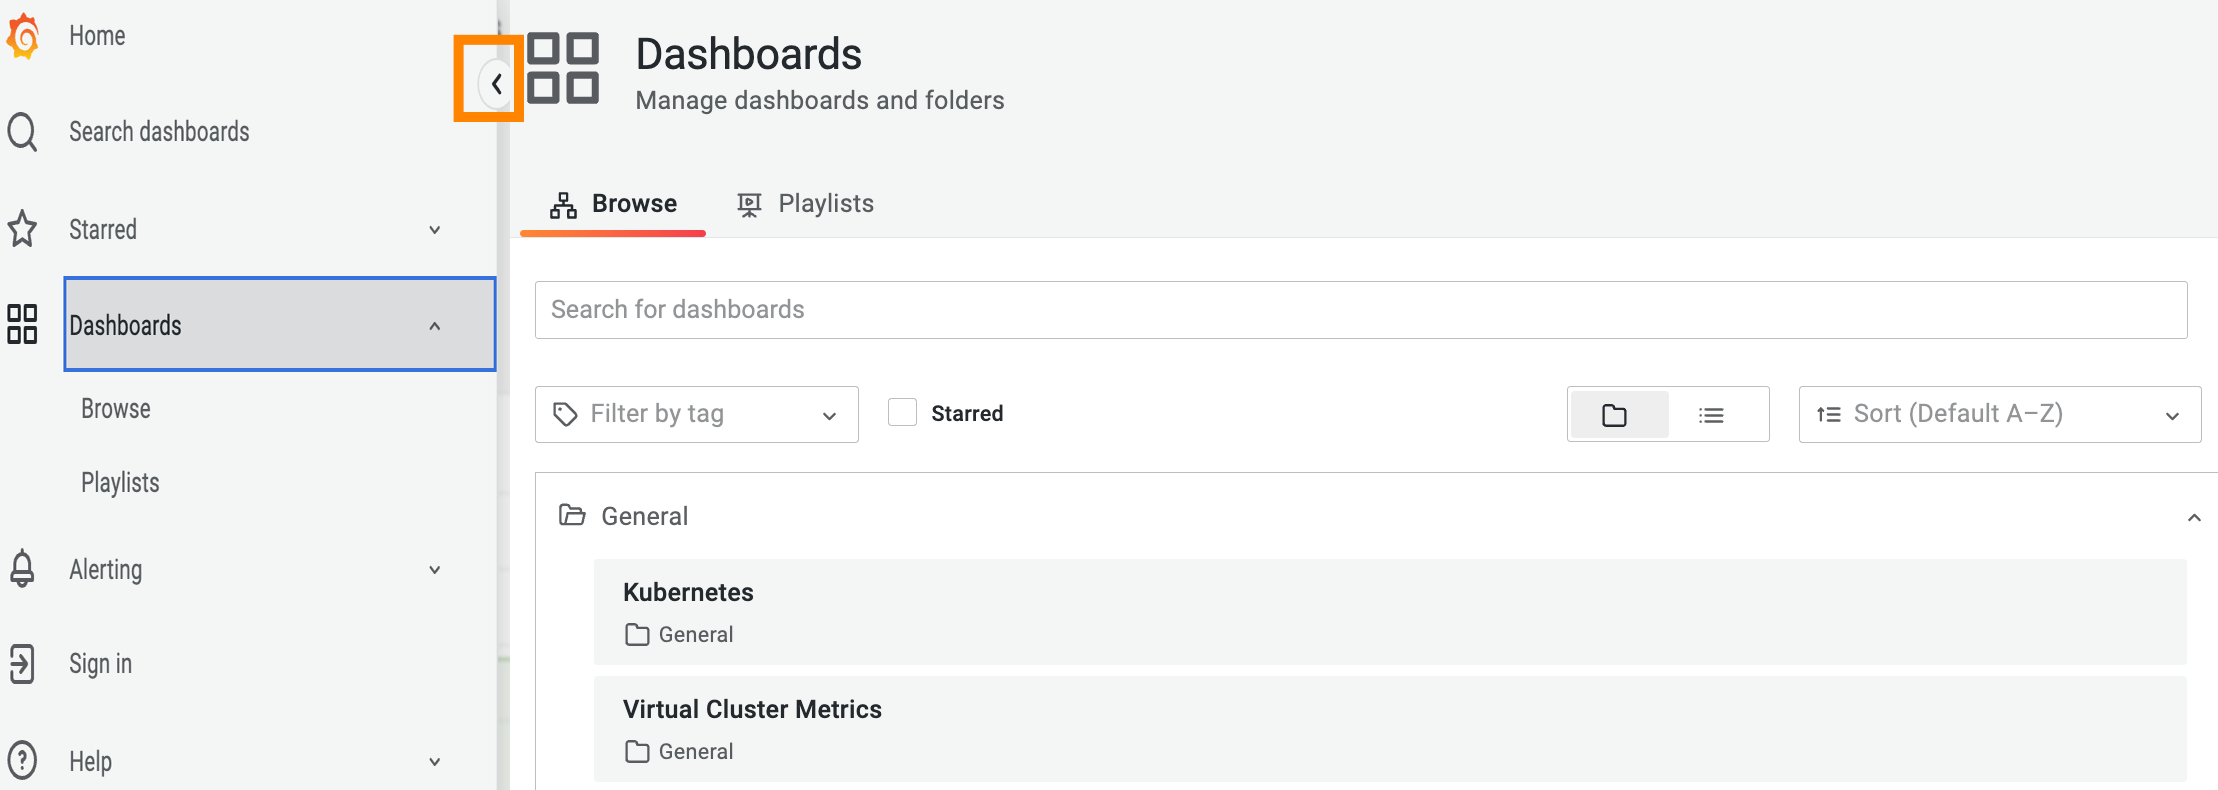
After you connect to the Grafana Dashboards from the Cloudera Data Engineering UI, click the
 icon
to view the left navigation pane.
icon
to view the left navigation pane.
-
In the Browse tab of Dashboards, click
Kubernetes or Virtual Cluster Metrics to
view the respective dashboard.