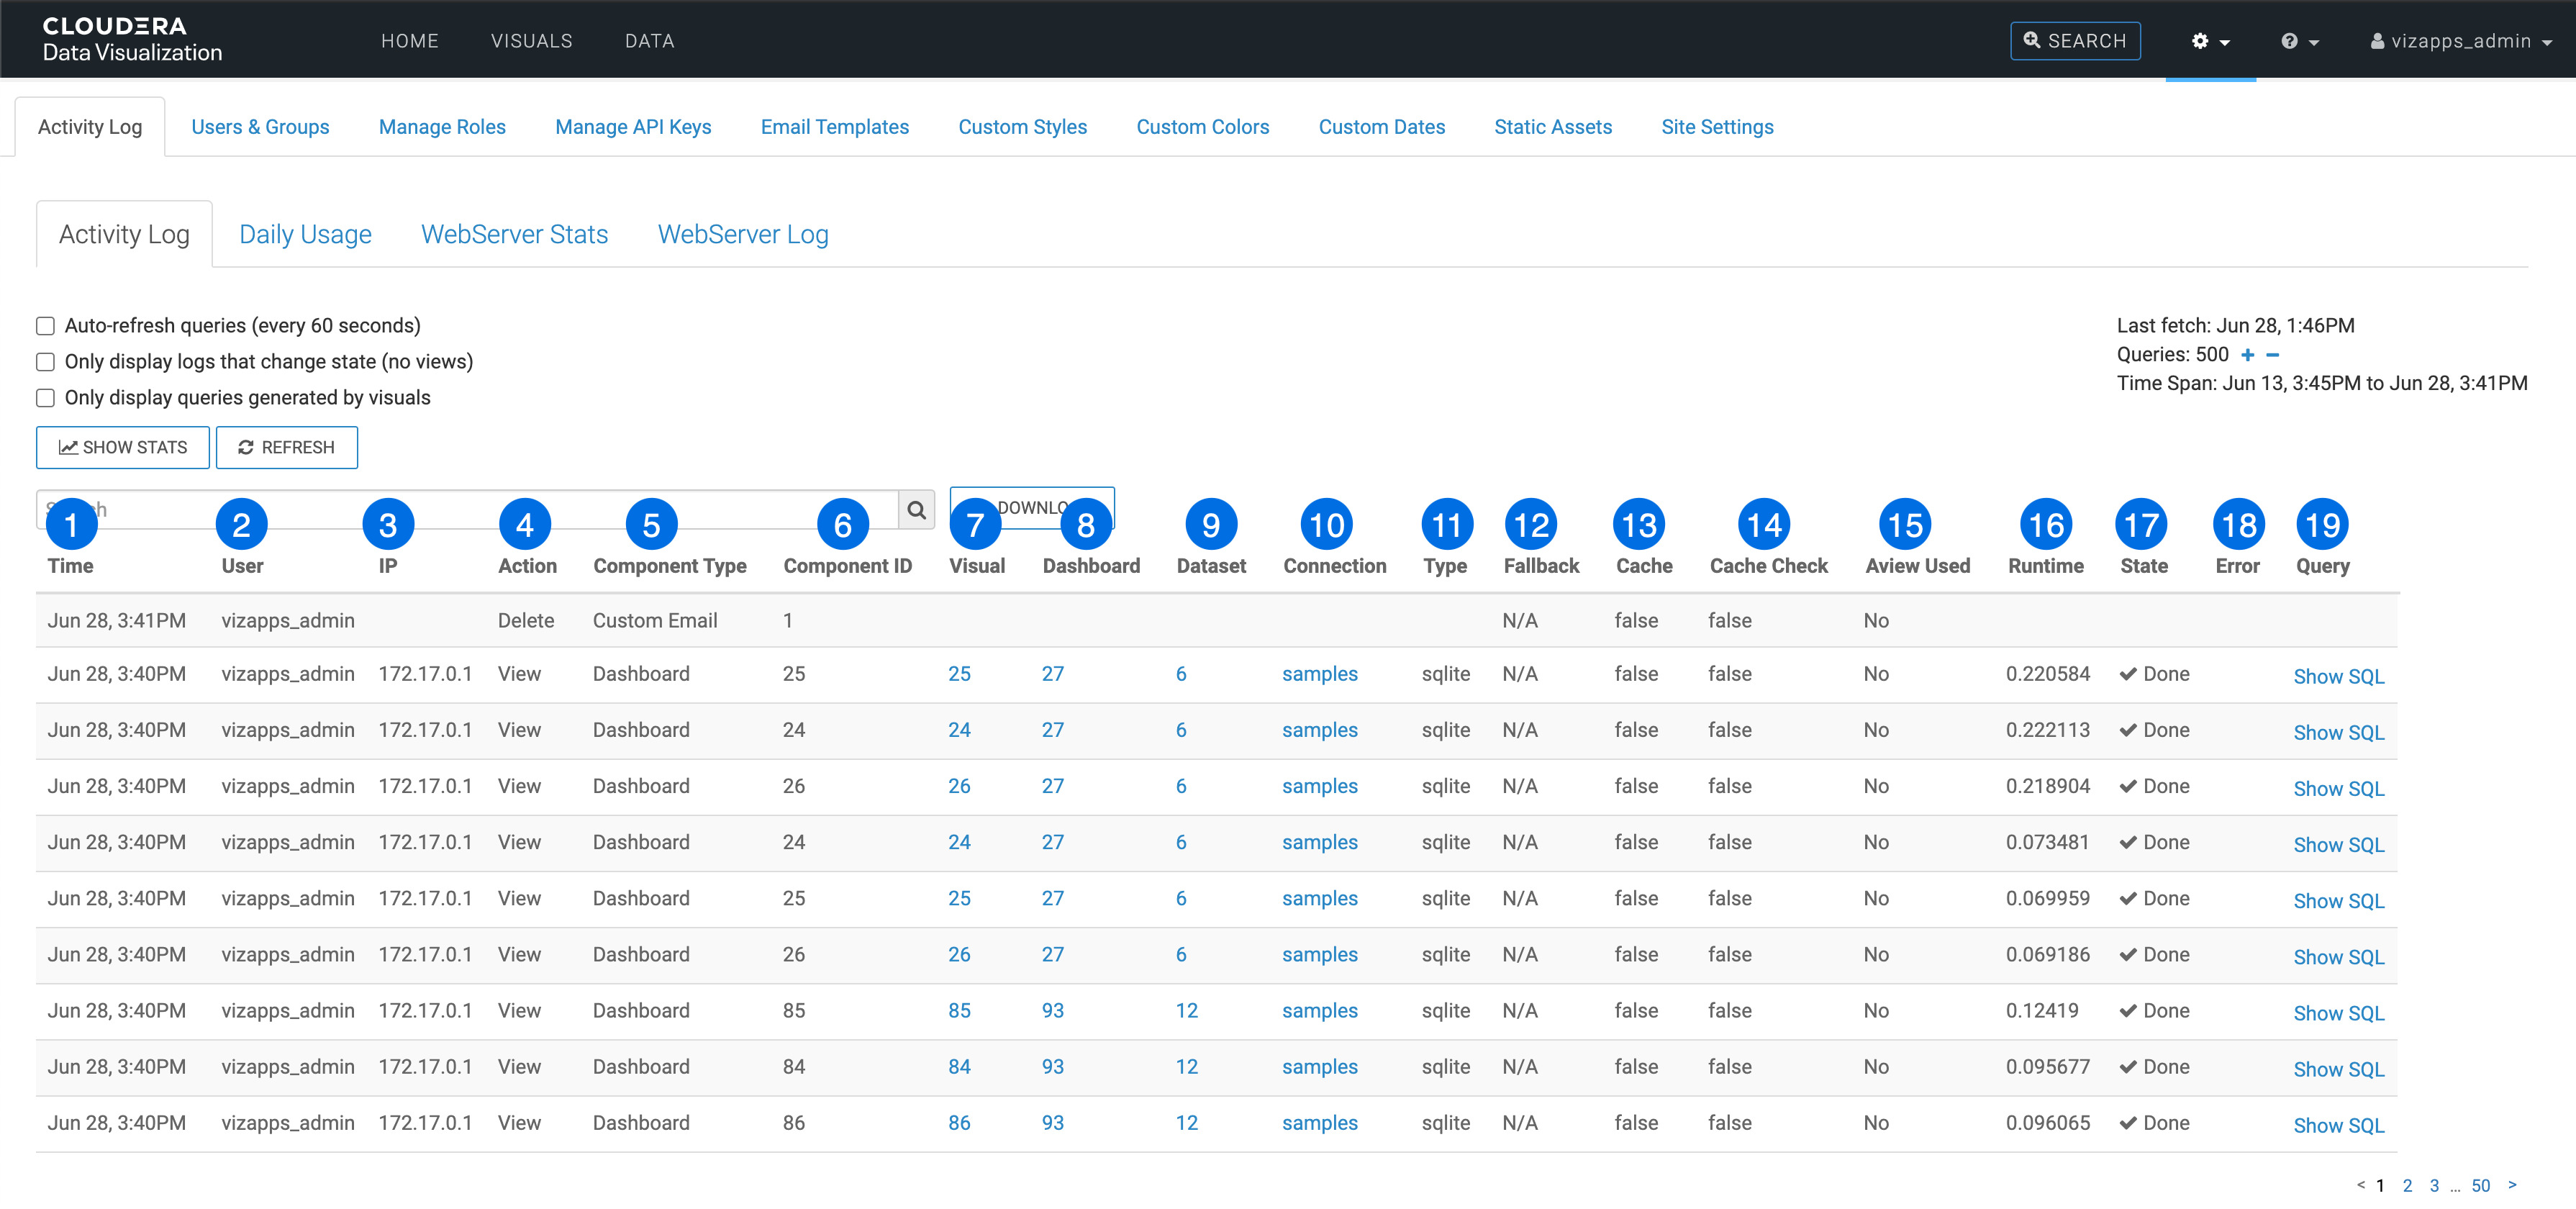
List view of Activity Log
Examine the list view of the activity log interface to obtain more detailed information.

-
Time
The date and time of the activity, such as April 16, 6:00 PM.
-
User
The username of the activity initiator.
-
IP
The IP address of the Data Visualization instance that originated the request.
-
Action
The type of event that generated the activity, such as View, Create, and Update.
-
Component Type
The component of the activity, such as Dashboard, Data Connection, Dataset, Mixed, Snapshots, Thumbnail, or Workspaces.
-
Component ID
The ID of the component.
-
Visual
The ID of the visual that generates the activity. Click on this number to navigate to the visual.
-
Dashboard
The ID of the dashboard that generates the activity. Click on this number to navigate to the dashboard.
-
Dataset
The ID of the dataset that generates the activity. Click on this number to navigate to the Dataset Detail interface for that dataset.
-
Connection
The name of the data connection for the activity. Click on this name to navigate to the Datasets interface for that connection.
-
Type
The type of connection, such as arcengine, impala, hive, and so on.
-
Fallback
If the connection is of arcengine type, you can have a fallback engine enabled. For example, the second row shows that Dashboard ID = 500 uses the fallback option. Typically, the value of this column is N/A.
-
Cache
This column indicates whether the query was served from the cache; values are true or false.
-
Cache Check
This column indicates that served the query from the cache after checking the base data to confirm that no changes occurred between the cache capture and the time the query ran in the cache. Values are true or false.
-
Aview Used
This column indicates if the query execution used an analytical view; values are Yes, No, or N/A.
-
Runtime
The duration of the activity, in seconds.
-
State
The completion status of the query, such as Done, if it is running, or if it is in an error state.
-
Error
This column shows if there is an error in any of the actions.
-
Query
You can examine the SQL statement for each query event.
By default, hides the SQL statements. To see all statements, click the Plus icon under the column title Query. To hide all statements, click the Minus icon. To see only specific queries, click Show SQL in the specific row.
For example, this is the SQL statement for the first Dashboard (component ID=500):
SELECT cast((((TA_0.'duration') - 0.007558) / 1.5571718) as bigint) as 'Buckets', sum(1) as 'Record Count'
            FROM 'default'.'historical_queries' TA_0 WHERE TA_0.'start_date' = to_date(date_sub(now(), interval 1 Days))
            GROUP BY 1
            LIMIT 5000
