Visual axes and labels styles in dashboards
You can adjust several style options for visual axes and labels in CDP Data Visualization dashboards.
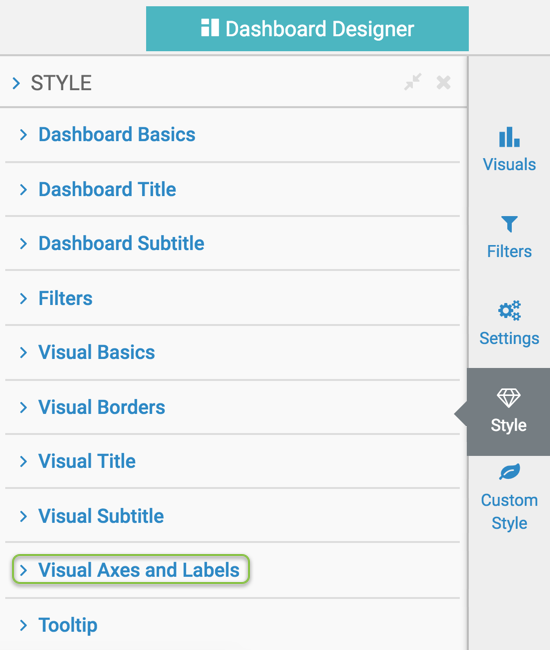
To get to the options in the Visual Axes and Labels menu, follow these steps:
- On the right side of Visual Designer, click the
Style menu.

- In the Style menu, click Visual Axes and
Labels.

- Select one of the options.
- To style the visuals individually, de-select the Override visual style settings option, and specify the corresponding setting in each visual.
