Displaying area legend
In an interactive map visual, CDP Data Visualization enables you to display area legend of circles.
- On the right side of Visual Designer, click the
Settings menu.
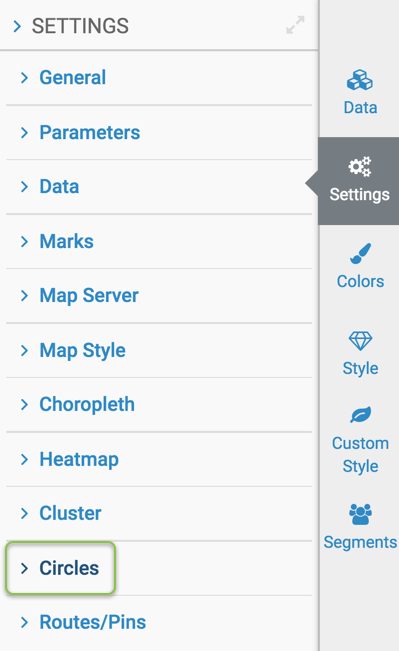
- In the Settings menu, click
Circles.
- To show the area legend for the Circles,
select Add Circles Area Legend option. This option is off by default. Make
sure you have one aggregate field in the Measures shelf.

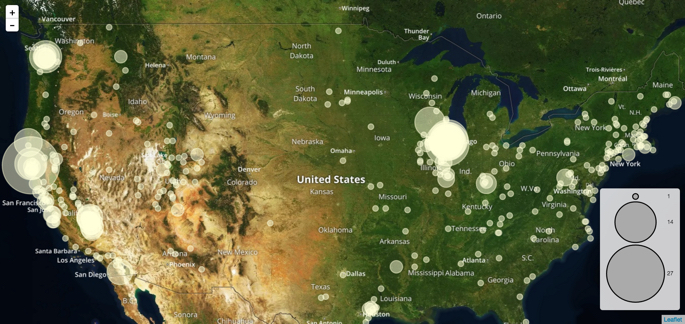
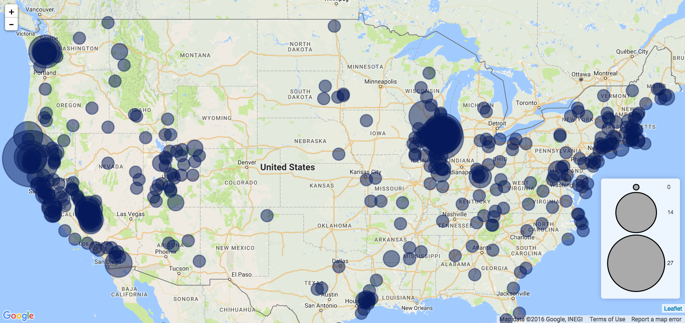
The area legend now appears on the lower-right corner of the Google Map with Circles.
And here is the Mapbox map with Circles and an area legend.