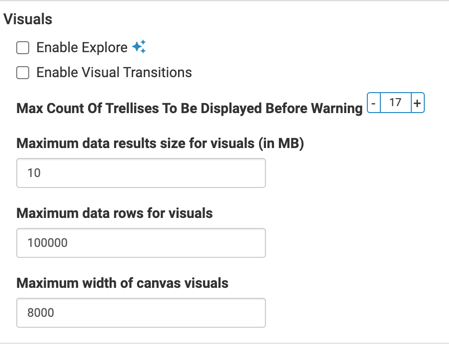
Visuals
In , you can enable various advanced visual options.
Enabling explore
You can use the explore function in to find the best visualization for your data request.
The Enable Explore option suggests new visual types and options based on the information you already use in existing visuals. See, Exploring visual options.
To enable the explore function, follow these steps:
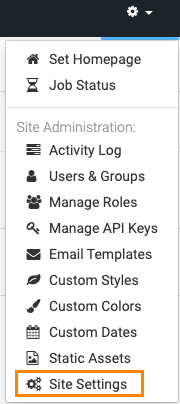
- Click the Gear icon to open the Site Administration menu, and select Site Settings.
- Under Visuals, select the Enable Explore option.
Enabling visual transitions
You can use the transitions function to animate visuals during loading and refresh operations. The visual types that use visual transitions include bars, lines, combo, area, scatter, grouped bar, histogram, sparklines, pie, packed bubbles, and correlation heat map.
To enable the transition function, follow these steps:
- Click the Gear icon to open the Site Administration menu, and select Site Settings.
- Under Visuals, select the Enable Visual Transitions option.
Setting maximum count of trellises to be displayed before warning
To adjust the maximum count of trellises, follow these steps:
- Click the Gear icon to open the Site Administration menu, and select Site Settings.
- Under Visuals, select the appropriate number for the maximum count of trellises.
Setting maximum data results size for visuals
To adjust the maximum data results size, follow these steps:
- Click the Gear icon to open the Site Administration menu, and select Site Settings.
- Under Visuals, enter a value in the Maximum data results size for visuals (in MB) text box.
Setting the maximum data rows in visuals
As a site administrator, you can provide an upper limit on the number of rows rendered in a visual request.
Sometimes an inexperienced or malicious user can create a visual requesting billions of rows. This may result in excessive resource consumption at the server level and the result might be too large to render in the client browser. To avoid this scenario, an administrator can provide an upper limit on the number of rows rendered in a visual request.
- Click the Gear icon on the main navigation bar to open the
Site Administration menu, and select Site
Settings.
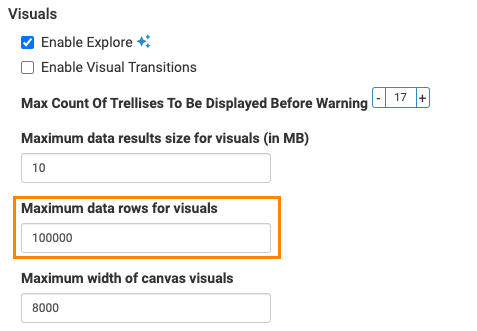
- Scroll down to the Visuals option and enter a value in the
Maximum data rows for visuals text box.
Downloading maximum data rows in visuals
Sometimes an inexperienced or malicious user can create a visual requesting billions of rows. This may result in excessive resource consumption at the server level and too large to render in the client browser. To avoid this, you as a site administrator can provide an upper limit on the number of rows rendered in a visual request.
To set the maximum data row value, follow these steps:
- Click the Gear icon to open the Site Administration menu, and select Site Settings.
- Under Visuals, enter a value in the Maximum data rows for visuals text box.
At the individual visual level, the setting in the Maximum number of rows to fetch option in the Data menu of the Visual Designer overrides this default behaviour.
At the site level, the setting in the Maximum data rows for visuals option overrides the setting in the Maximum number of rows to fetch option.
Setting the maximum width of canvas visuals
Cloudera recommends that you designate a reasonable maximum width for canvas visuals considering performance reasons Overly wide visuals that display streaming data may cause the Internet browser to crash.
To set the maximum width value, follow these steps:
- Click the Gear icon to open the Site Administration menu, and select Site Settings.
- Under Visuals, enter a value in the Maximum width of canvas visuals text box.