Configuring a cross tabulation visual for expansion
Follow these steps to enable expansion for a Cross Tabulation visual.
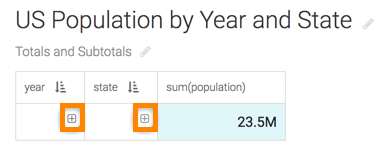
This example shows how to enable expansion on the year and
state fields.
-
Click REFRESH VISUAL.
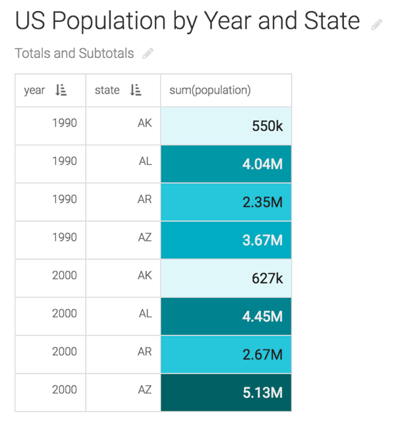
When the Cross Tabulation visual appears, it does not have subtotals and the combined total in the rows and columns.
-
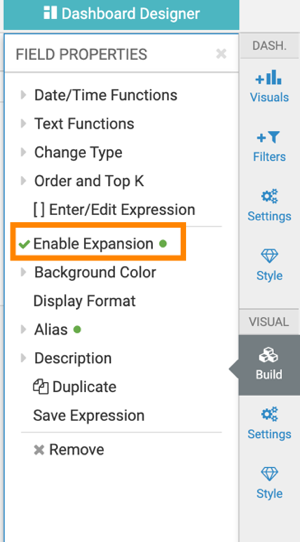
In the FIELD PROPERTIES menu, click Enable
Expansion.
A green tick appears to the left of the option and a green dot appears to the right of the option.
-
Click REFRESH VISUAL to see the changes.
The visual appears with a + icon in the year and state columns. This indicates that you can expand the data.
The sum(population) column shows the combined population for both years.