Creating filters to control optional measures
- In the dashboard, click the Filters tab.
-
Click Create Custom Filter to create a second dashboard
filter.
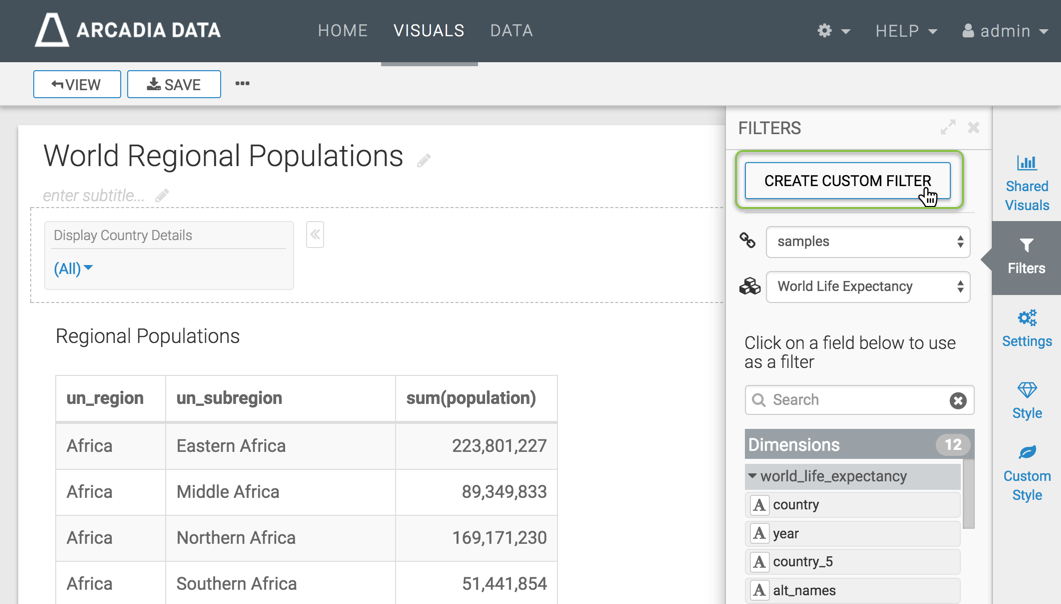
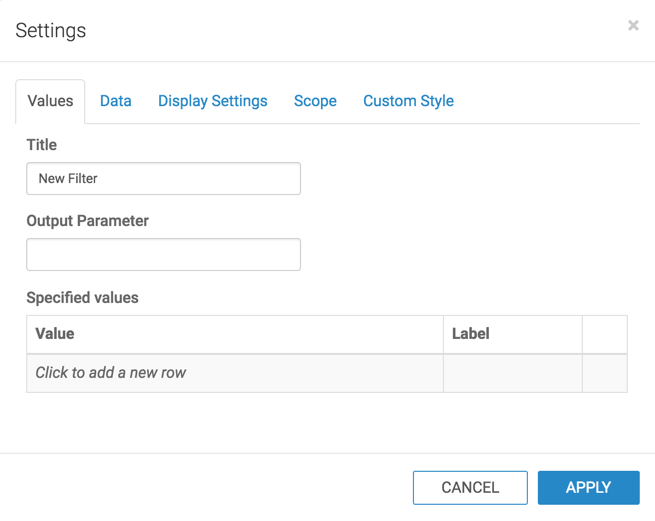
This creates a New Filter in the filter area of the application, and opens the Settings window modal for that filter.
-
In the Settings modal window, under the
Values tab, enter the following:
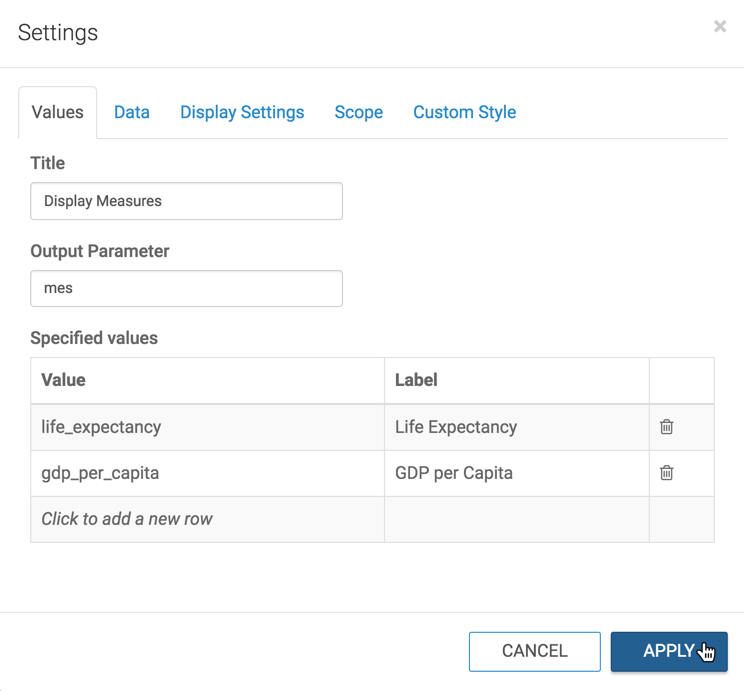
- Under Title, enter Display Measures.
-
Under Output Parameter, enter mes.
Note that this is the parameter from Creating visuals with optional measures.
-
Under Specified values, enter the following two rows:
- Value:
life_expectancy, Label: Life Expectancy - Value:
gdp_per_capita, Label: GDP per Capita
- Value:
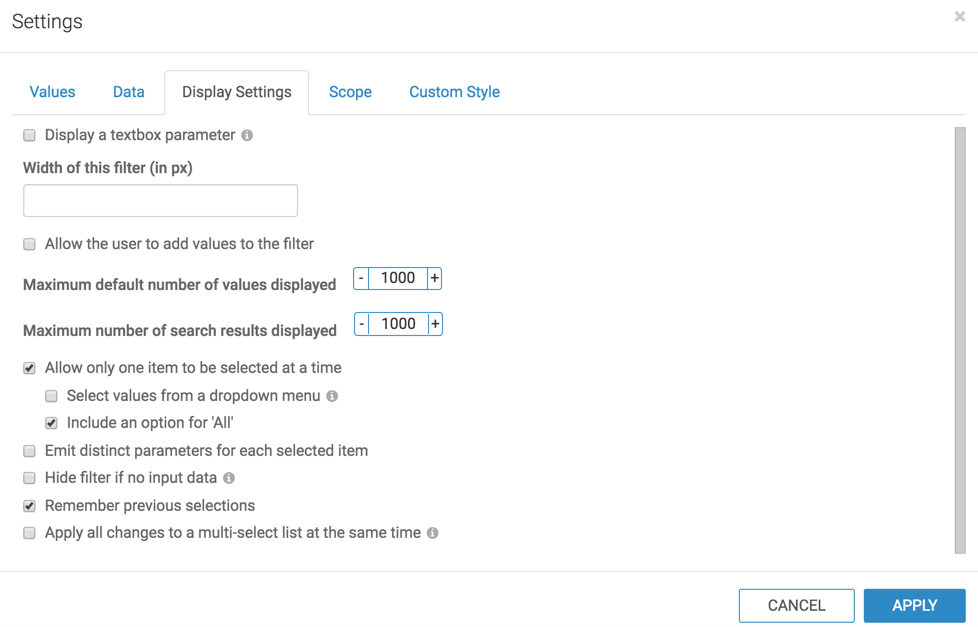
- In the Settings modal window, switch to Display Settings.
- Select Allow only one item to be selected at a time
- Select Include an option for 'All'.
-
Click Apply.
- Name and save the dashboard.
-
Switch to application View mode, and select World
Regional Populations.
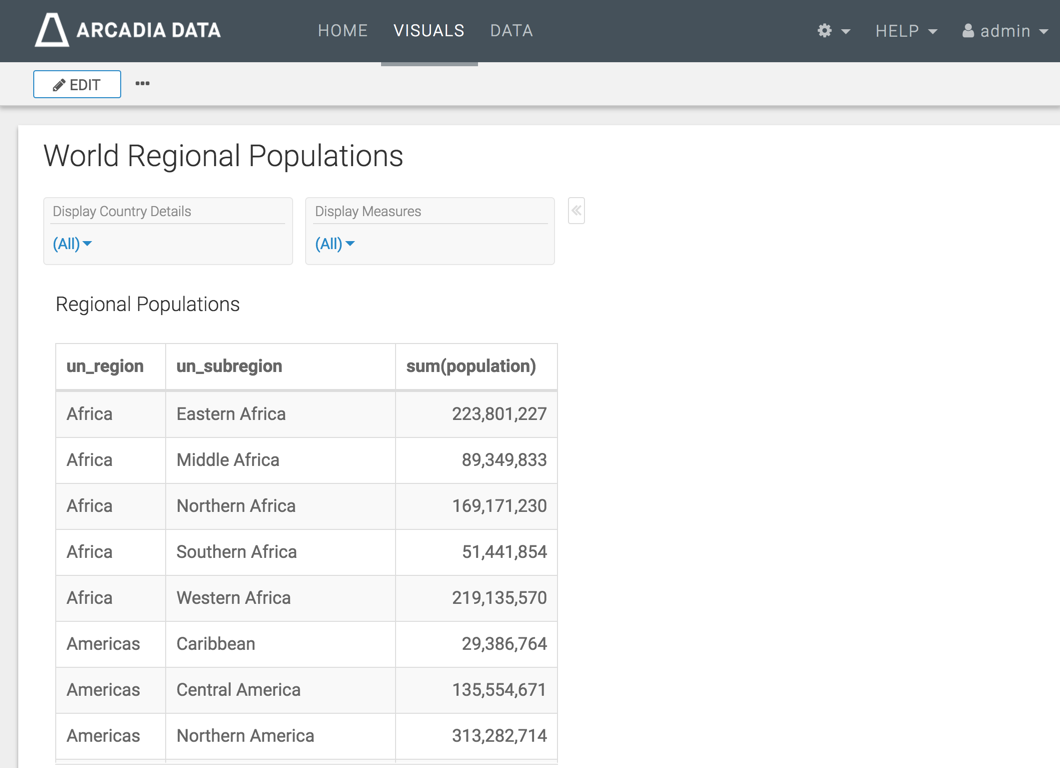
- [Optional] In the Display Country Details filter, select Country.
-
In the Display Measures filter, select Life
Expectancy.
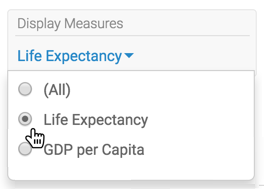
Note that the table now has a new column, life_expectancy.

-
To change the measure that appears in the visual, in the Display
Measures filter, select GDP per Capita.
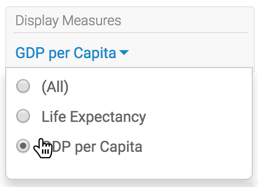
Note that the additional column is now titled gdp_per_capita, not life_expectancy.
To check the parameters of the dashboard, hover the pointer over the Filter icon at the top right corner. They are:
dim: countrydim.alias: Countrymes: gdp_per_capita
You can scroll down to see
mes.alias: GDP per Capitaparameter
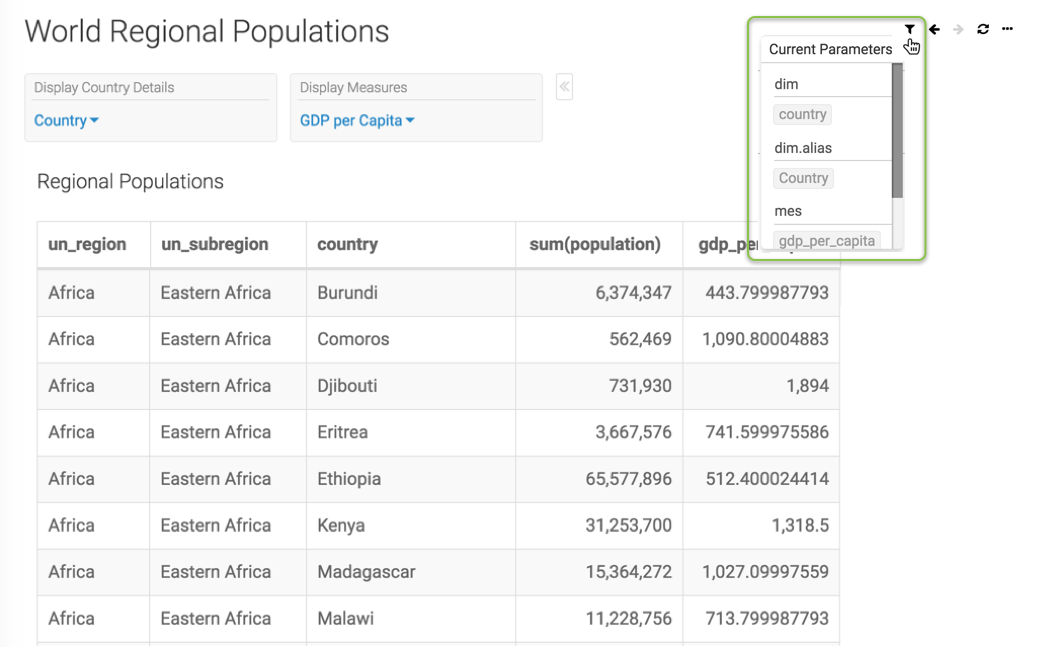
- [Optional] You can easily navigate between the permutations of filter outputs you create by using filter navigation controls at the top right corner.
