Displaying color legend
In an interactive map visual, Cloudera Data Visualization enables you to display color legend of circles.
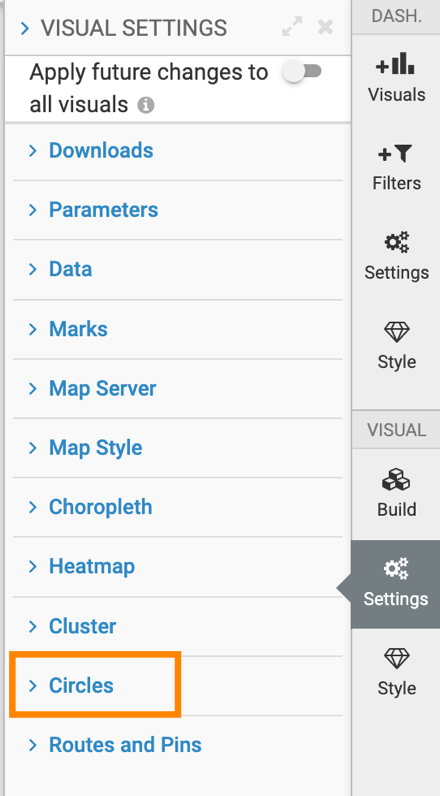
- In the Settings menu, click
Circles.
-
To show the color legend for Circles, select the
Add Color Legend option.
This option is off by default.
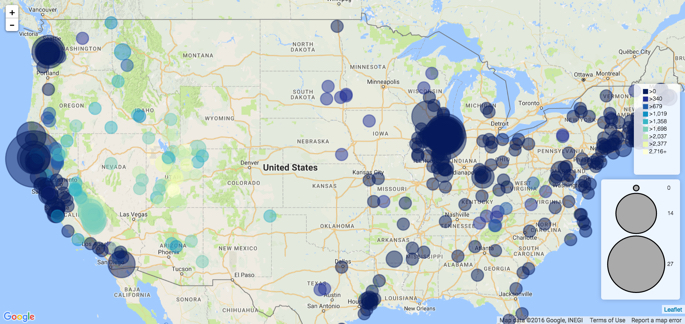
The following image shows a Google Map with Circles, plotting two measures: elevation and count of features. You can see that the first measure appears as colors that you can check in the color legend, while the second measurement displays as size that you can see in the area legend.
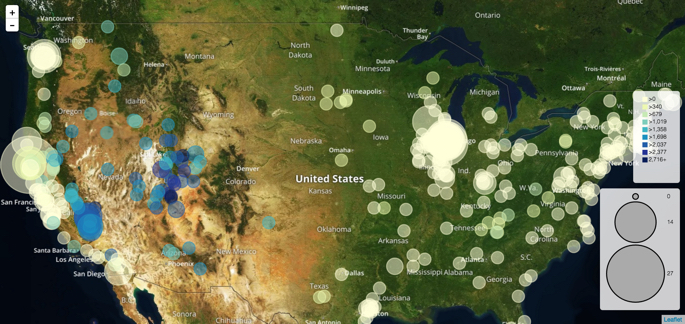
The following image shows a Mapbox Map with Circles and two measures: elevation and count of features. Elevation appears as colors, and feature count is represented by the area of the circle.